

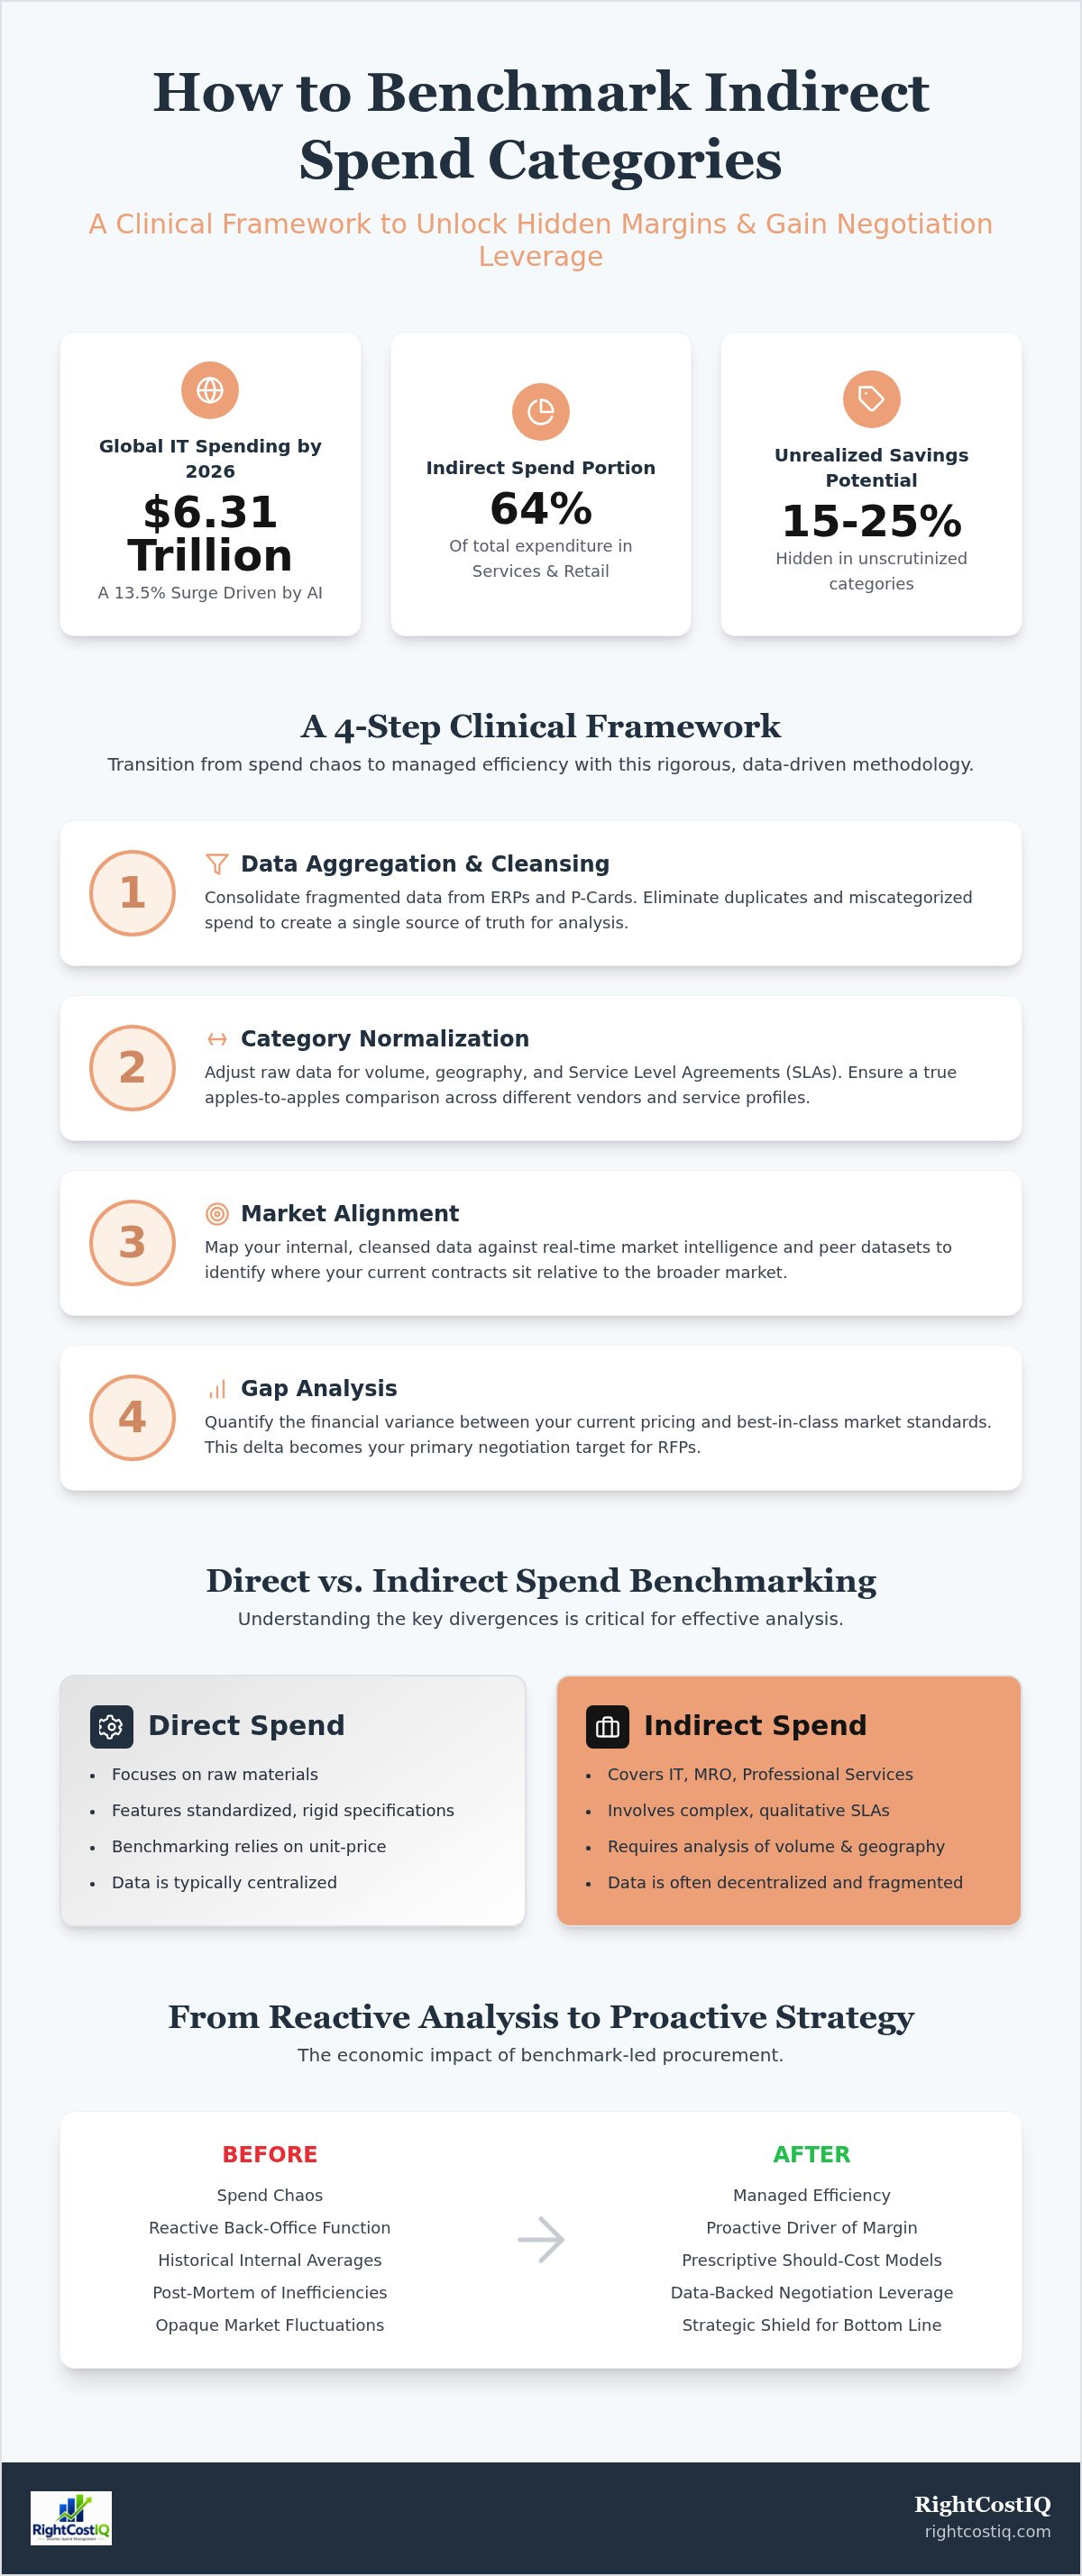
In 2026, global IT spending is projected to hit $6.31 trillion, representing a 13.5% surge driven by intensive AI infrastructure investments. For procurement leaders in the services and retail sectors, where indirect spend constitutes 64% of total expenditure, these rising costs often remain hidden within fragmented ERP systems or maverick travel and marketing transactions. You likely recognize that your current spend visibility is insufficient to drive aggressive negotiations or maintain competitive advantage. Learning how to benchmark indirect spend categories with clinical precision is the only way to regain leverage and ensure precise market alignment.
This article provides a rigorous, data-driven methodology to quantify your performance against current market realities. We move beyond basic descriptive analysis to introduce a prescriptive should-cost modeling framework. You'll master a repeatable process for normalizing data across decentralized categories and identifying the specific areas with the highest savings potential. This guide delivers the data-backed evidence required to support high-stakes RFP negotiations and unlock the hidden margins currently trapped in your supply chain. It's time to transition from spend chaos to managed efficiency.
Key Takeaways
- Deploy a 4-step clinical framework to master how to benchmark indirect spend categories, ensuring rigorous data normalization across fragmented ERP systems and decentralized spend environments.
- Capture the 15-25% in unrealized savings inherent in indirect procurement by implementing systematic performance comparisons against precise, real-time external market standards.
- Utilize a structured "Benchmark-to-Bid" workflow to convert prescriptive should-cost modeling into data-backed evidence for aggressive RFP negotiations and strategic vendor selection.
- Establish a continuous benchmarking infrastructure using automated procurement analytics to maintain operational efficiency and cost optimization in volatile market conditions.
The Strategic Mandate for Indirect Spend Benchmarking
Benchmarking in indirect procurement is the systematic comparison of category costs against external market standards to identify performance gaps. While direct spend focuses on raw materials with rigid specifications, indirect categories such as IT, MRO, and Professional Services often hide 15-25% in unrealized savings. These categories frequently escape rigorous scrutiny due to their decentralized nature and fragmented data across multiple ERP systems. Mastering how to benchmark indirect spend categories transforms procurement from a reactive back-office function into a proactive driver of enterprise margin resilience.
Traditional descriptive spend analysis only provides a historical view of what was paid. It's a post-mortem of past inefficiencies that does nothing to influence future outcomes. In contrast, prescriptive benchmarking utilizes market intelligence to model future-state costs. This clinical approach allows decision-makers to align their procurement strategy with current market realities rather than historical internal averages. It's the difference between knowing you overpaid and ensuring you never do it again.
Direct vs. Indirect Benchmarking: Key Divergences
Understanding how to benchmark indirect spend categories requires a more sophisticated lens than direct material sourcing. Direct spend categories typically feature standardized specifications; a ton of grade-A steel is a known quantity. Indirect categories involve complex service level agreements (SLAs) and vendor performance metrics that are often qualitative. Unit-price benchmarking is insufficient here. A lower hourly rate for a consultant means nothing if the project timeline doubles. Effective analysis must account for volume, geography, and specific technical requirements to ensure an apples-to-apples comparison between vendors.
The Economic Impact of Benchmark-Led Procurement
The financial implications of rigorous benchmarking are immediate and measurable. By aligning costs with market standards, organizations directly improve EBITDA through sustained cost reduction. This practice is vital in inflationary environments where price volatility can erode margins overnight. For example, with airfare rising over 8% year-over-year in early 2026, data-backed benchmarks provide the necessary leverage to resist unjustified supplier price hikes. Integrating these insights into a broader category management procurement strategy ensures that short-term savings evolve into long-term value creation. This data-driven precision acts as a strategic shield, protecting the bottom line from opaque market fluctuations and supplier-driven margin creep.
A 4-Step Clinical Framework for Benchmarking Indirect Categories
Mastering how to benchmark indirect spend categories requires a rigorous, four-step clinical approach that prioritizes data integrity over anecdotal evidence. This framework moves beyond simple price comparisons to establish a comprehensive view of value and efficiency. By following these steps, procurement teams can transform opaque cost centers into an untapped lever to drive enterprise-wide impact. This systematic transition from tail spend chaos to managed efficiency is essential for maintaining a competitive edge.
- Step 1: Data Aggregation and Cleansing. Consolidate fragmented data from multiple ERP systems and P-Card transactions. This step eliminates the noise of duplicate entries and miscategorized spend, providing a single source of truth for all subsequent analysis.
- Step 2: Category Normalization. Adjust raw data to account for volume discounts, geographic price variations, and specific service level agreements (SLAs). This ensures that you're comparing identical service profiles across different vendors.
- Step 3: Market Alignment. Map internal cleansed data against real-time market intelligence and peer datasets. This step identifies where your current contracts sit relative to the broader market and highlights areas of overpayment.
- Step 4: Gap Analysis. Quantify the financial variance between your current pricing and best-in-class standards. This delta represents your primary negotiation target and informs your RFP strategy.
Normalization: The Engine of Benchmarking Accuracy
Normalization is the process of removing variables that skew cost comparisons. Without it, benchmarking is a futile exercise in comparing apples to oranges. For instance, a global IT contract can't be benchmarked solely on seat count without accounting for regional price indices and support hours. Techniques for adjusting these service comparisons involve weighting variables such as response times, regulatory compliance costs, and technical specifications. It's the level of precision that separates high-performing procurement teams from those simply chasing the lowest bid without considering total cost of ownership.
Identifying the Benchmarking Baseline
Determining how to benchmark indirect spend categories effectively depends on establishing an accurate baseline. Are you aiming for industry averages or top-quartile performance? While averages provide a safety net, top-quartile benchmarks drive significant margin expansion. Historical price trending is essential here to forecast future benchmarks, especially in volatile sectors like business travel or marketing. Leveraging should-cost models allows you to establish a theoretical price floor based on bottom-up cost drivers rather than just market quotes. Understanding these baselines is the first step toward reclaiming lost margin. To begin your assessment, consider a diagnostic spend review to pinpoint immediate opportunities for optimization.
Benchmarking the "Big 5" Indirect Spend Categories
To execute a clinical cost optimization strategy, procurement leaders must move beyond aggregate spend data and dissect the specific cost drivers within the "Big 5" indirect categories. Understanding how to benchmark indirect spend categories requires a granular analysis of market-facing rates versus internal historical costs. Each category demands a unique set of KPIs to differentiate between market-average performance and best-in-class efficiency.
- Marketing and Advertising: With B2B companies allocating an average of 9.4% of revenue to marketing in 2025, benchmarking agency fees and media buy transparency is critical. Effective analysis requires auditing production costs and ensuring that agency markups align with current market standards for creative services.
- Logistics and Freight: Benchmarking here involves a deep dive into lane rates, fuel surcharges, and accessorial charges. In a volatile market, comparing your carrier rates against real-time lane indices is the only way to prevent margin erosion.
- Professional Services: This category is often opaque. Benchmarking must normalize hourly rates for legal and consulting services. For instance, while the average flat fee to review a professional services agreement is $640.00 as of June 2026, independent consultants in the US charge between $100 and $500 per hour. Precision in these benchmarks prevents overpayment for specialized expertise.
IT and Telecommunications: Benchmarking the Digital Stack
Global IT spending is projected to reach $6.31 trillion in 2026, making it the most significant indirect expense for many enterprises. Benchmarking the digital stack involves measuring cost-per-user metrics against enterprise license agreements (ELAs) to ensure scalability doesn't lead to waste. Procurement teams must scrutinize cloud consumption, specifically data egress fees and storage tiers, which often hide significant inefficiencies. Implementing rigorous tail spend management is essential for capturing shadow IT costs that bypass centralized procurement controls.
MRO and Facilities: Managing the High-Volume Tail
Maintenance, Repair, and Operations (MRO) categories are characterized by high SKU complexity and a massive volume of small-dollar transactions. Benchmarking success in MRO relies on consolidating vendors to leverage volume-based pricing. Rather than benchmarking every item, focus on a "basket of goods" that represents 80% of your spend. Utilizing e-procurement platforms increases benchmarking precision by providing real-time visibility into SKU-level pricing, allowing for immediate market alignment and the elimination of off-contract purchasing. This clinical approach ensures that high-volume tail spend doesn't compromise enterprise margins.
Translating Benchmarks into Negotiation Leverage
Data aggregation is only the diagnostic phase. The real value of learning how to benchmark indirect spend categories lies in your ability to weaponize that data during supplier interactions. Gap analysis identifies the specific financial delta between your current contracts and the top-quartile market performers. This quantitative evidence removes the ambiguity from vendor selection, allowing you to prioritize incumbents or new bidders based on their willingness to align with verified market rates. It's about shifting the power balance from the seller to the buyer through clinical evidence.
Understanding how to benchmark indirect spend categories with this level of detail enables a "Benchmark-to-Bid" workflow that ensures every negotiation script is rooted in clinical reality. By leveraging market price trending, procurement teams can secure price-cap protections that mitigate the volatility seen in 2026. For example, knowing that hotel rates increased by nearly 6% year-over-year in early 2026 allows you to negotiate fixed-rate caps or index-linked pricing that prevents unmanaged cost creep. Integrating vendor performance tracking further strengthens your position. Poor service levels documented against high costs provide undeniable justification for cost-reduction demands that vendors can't easily dismiss.
RFP Management: The Clinical Execution of Benchmarks
Structuring an RFP requires more than a list of requirements. It must be designed to validate your benchmarking assumptions. An RFP is the primary mechanism for testing theoretical benchmarks against live market reality. By utilizing RFP management frameworks, you ensure sourcing precision that forces vendors to compete on a level playing field. This process flushes out "hidden" costs and ensures that the final bids represent the true market floor for your specific volume and geography. It's the ultimate stress test for your cost-optimization theories.
The Negotiation Coach: Data-Backed Assertiveness
Assertiveness at the negotiation table is a product of data certainty. You're no longer asking for a generic discount. Instead, your narrative shifts: "Our market data indicates a 12% overage compared to peer organizations with similar IT consumption profiles." This precision effectively counters vendor objections regarding "unique service requirements" or "customized solutions" that often serve as smoke screens for high margins. Accessing professional negotiation assistance for high-stakes indirect contracts provides the tactical edge needed to close these gaps. To identify where your current contracts deviate from the market, start with a free procurement diagnostic today.
Building a Continuous Benchmarking Infrastructure
One-time benchmarking events fail because they provide a static solution for a dynamic problem. In a market defined by rapid volatility, a benchmark from six months ago is often obsolete before the next RFP cycle begins. For instance, with global business travel spending forecasted to reach $1.71 trillion in 2026 and airfare rising over 8% in early 2026, static data cannot protect your margins. Institutionalizing how to benchmark indirect spend categories requires a transition from manual spreadsheets to automated procurement analytics that provide real-time cost tracking and immediate market alignment.
Proactive price risk management is the final stage of procurement maturity. The C-Suite must play a critical role in this evolution by establishing benchmarking as a permanent KPI rather than a project-based initiative. This shift ensures that enterprise margin resilience isn't dependent on individual negotiator skill but on a standardized, data-driven infrastructure. High-level decision-makers should demand regular reports that compare internal contract performance against top-quartile market performers to ensure the organization isn't leaking value through outdated agreements or unmanaged tail spend.
Procurement Technology as a Strategic Enabler
Integrating live market feeds into spend analytics platforms allows for instantaneous gap analysis across decentralized categories. The shift toward AI-led category cost benchmarking enables the system to flag price anomalies as they occur, rather than months after the invoice is paid. When evaluating a procurement platform, focus on its ability to ingest external market intelligence and map it directly against your internal SKU-level data. This technological integration is the only way to maintain market alignment at scale while managing thousands of indirect SKUs. It bridges the gap between traditional business functions and cutting-edge digital innovation, providing the transparency required for high-stakes negotiations.
Next Steps: Execute Your Savings Diagnostic
Establishing a baseline diagnostic is the essential first step to identify immediate low-hanging fruit within your indirect spend. Prioritize categories based on total spend volume and the degree of benchmark variance identified in your initial scan. A category like IT, with its projected 13.5% spending increase in 2026, often yields the most significant immediate returns through rigorous license and cloud consumption benchmarking. You don't need to overhaul every category simultaneously. Focus on the high-impact areas where market data indicates the largest overages. To identify these hidden opportunities and master how to benchmark indirect spend categories effectively, execute your free procurement diagnostic to identify hidden category savings and begin the transition to managed efficiency.
Securing Long-Term Margin Resilience
Mastering how to benchmark indirect spend categories is no longer optional; it's a strategic imperative for the modern procurement architect. By shifting from historical spend analysis to a prescriptive, data-driven framework, your organization can capture the 15-25% in unrealized savings often buried in IT, MRO, and professional services. This clinical approach ensures that every contract aligns with top-quartile market standards, protecting the bottom line against the price volatility forecast for 2026. You now have the technical methodology to transition from tail spend chaos to managed efficiency.
Sustained success requires more than a one-time audit. It demands a continuous benchmarking infrastructure supported by precision-led RFP management and advanced market price trending. Our global reach in procurement optimization and risk management provides the specialized edge needed to transform theoretical benchmarks into tangible financial growth. The path to precise market alignment and hidden margin recovery is clear. Identify your hidden category savings with a Free Procurement Diagnostic and start optimizing your indirect spend today.
Frequently Asked Questions
What is the difference between spend analysis and benchmarking?
Spend analysis is an internal, historical audit of past expenditures across vendors and categories. Benchmarking is the clinical comparison of those internal costs against external market standards to identify performance gaps. While spend analysis identifies where the money went, benchmarking reveals the market-aligned price you should be paying. This distinction is critical for transitioning from descriptive reporting to prescriptive cost optimization.
How often should indirect spend categories be benchmarked?
High-volatility categories like business travel and IT should be benchmarked quarterly or through continuous automated monitoring. More stable categories, such as MRO or facilities management, typically require an annual review. This frequency ensures your procurement strategy remains aligned with shifting market indices and prevents margin erosion from unmanaged price hikes in inflationary environments.
Can small businesses benchmark indirect spend effectively?
Small businesses can benchmark effectively by leveraging third-party market intelligence and procurement analytics aggregators. While they lack the massive internal datasets of global enterprises, they can still achieve significant savings by comparing their rates against industry averages. This data-driven approach provides the necessary leverage for aggressive negotiations even with lower total spend volumes.
Which indirect categories offer the highest potential for savings?
IT and software, marketing, and professional services typically offer the highest savings potential due to their inherent pricing opacity. These categories often hide significant unrealized savings because of complex service levels and decentralized purchasing patterns. Mastering how to benchmark indirect spend categories in these specific areas is the most efficient path to rapid enterprise margin expansion.
What data sources are used for indirect procurement benchmarking?
Effective benchmarking utilizes a mix of market price indices, peer-group data, and recent RFP results. Procurement teams also rely on proprietary databases and forecasting services to track real-time price trending. Combining these diverse sources creates a clinical baseline that accounts for geographic variations and specific service requirements, ensuring a true apples-to-apples comparison.
How do I handle maverick spend when trying to benchmark?
Maverick spend is managed through rigorous data cleansing of P-card and ERP transactions to identify off-contract purchases. Once identified, these transactions are normalized and benchmarked against preferred vendor rates. This process quantifies the financial impact of non-compliance, providing the data-backed evidence needed to enforce centralized procurement policies and consolidate spend under managed contracts.
What is a should-cost model in indirect procurement?
A should-cost model is a bottom-up analytical tool that estimates the fair market price of a service or product based on its core cost drivers. In indirect procurement, this includes labor rates, overhead, and a reasonable profit margin. This model establishes a theoretical price floor, allowing procurement leaders to challenge supplier quotes with clinical precision during high-stakes negotiations.
How do I benchmark services where pricing is not standardized?
Non-standardized services are benchmarked by normalizing rate cards and utilizing output-based performance metrics. By adjusting for variables like consultant experience levels and geographic location, you create a standardized comparison framework. This methodology is essential for how to benchmark indirect spend categories like legal or specialized consulting, where value is often perceived as subjective rather than quantifiable.


