
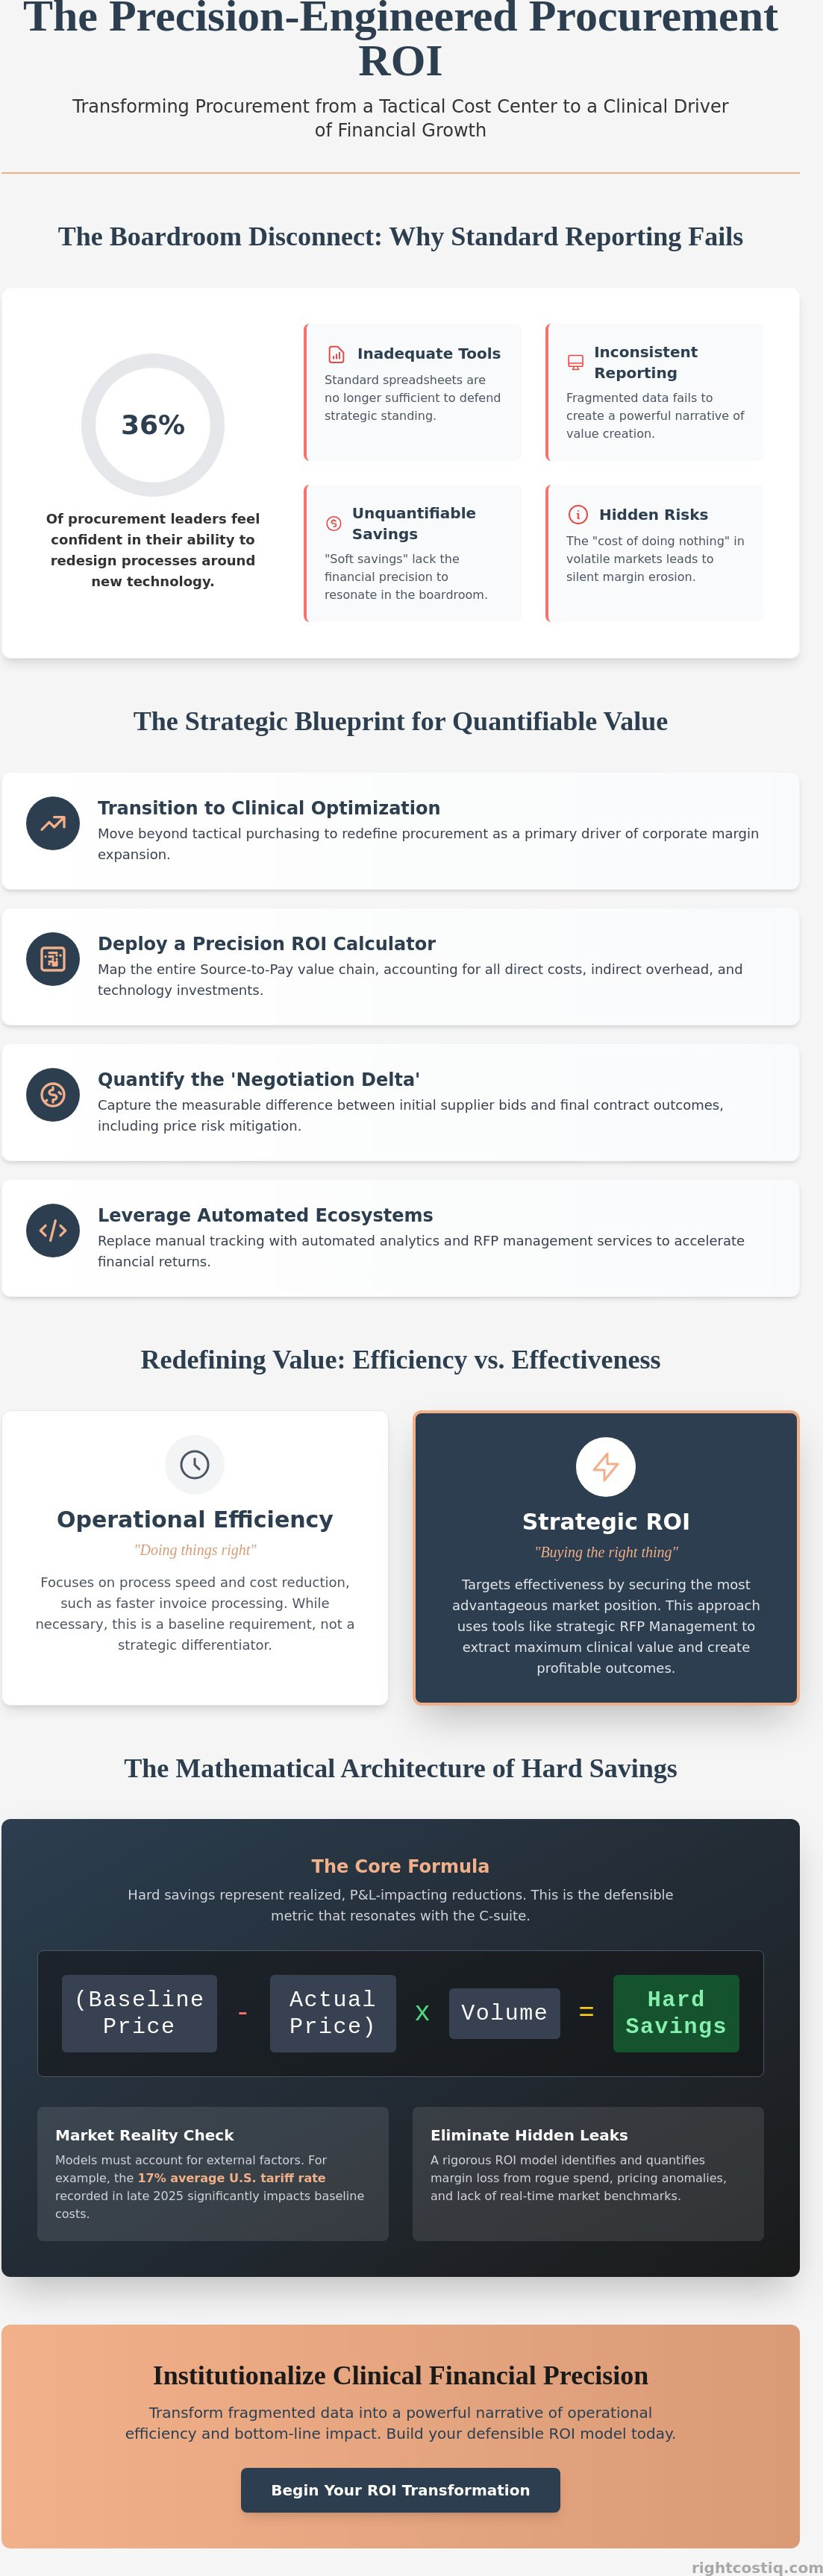
What if the perceived value of your procurement function is currently limited by the inadequacy of your reporting tools rather than the quality of your negotiations? Many procurement leaders find themselves trapped in a cycle of inconsistent reporting and unquantifiable soft savings that fail to resonate in the boardroom. You likely recognize that a standard spreadsheet is no longer sufficient to defend your strategic standing, especially when only 36% of procurement leaders feel confident in their ability to redesign processes around the current technological shift. This article delivers a precision-engineered procurement ROI calculator template designed to move your department from a tactical cost-center to a clinical driver of financial growth.
We provide the exact formulas required to differentiate between cost avoidance and hard cost savings while integrating critical market-indexed benchmarks. You'll learn how to build a defensible ROI model that withstands C-suite scrutiny and accounts for modern complexities like the 17% average U.S. tariff rates recorded in late 2025. This guide previews a standardized framework for quantifying procurement value with absolute financial precision and strategic urgency. By establishing a rigorous quantification methodology, you can transform fragmented data into a powerful narrative of operational efficiency and bottom-line impact.
Key Takeaways
- Transition from tactical purchasing to clinical category optimization to redefine the procurement function as a primary driver of corporate margin expansion.
- Deploy a precision-engineered procurement ROI calculator template that maps the entire Source-to-Pay value chain, accounting for direct costs, indirect overhead, and technology investments.
- Quantify the 'Negotiation Delta' to capture the measurable delta between initial supplier bids and final contract outcomes, including advanced price risk mitigation.
- Execute a rigorous two-step framework for model construction, focusing on data normalization across global spend and specific category segmentation for direct versus tail spend.
- Leverage automated analytical ecosystems and RFP management services to replace manual tracking and accelerate immediate financial returns for the organization.
The Strategic Necessity of ROI Quantification in Modern Procurement
The transition from a reactive cost center to a strategic driver of margin expansion is the defining shift for procurement in 2026. High-performing organizations no longer view purchasing as a clerical task; they treat it as clinical category optimization. This evolution requires a rigorous, data-driven framework to prove financial impact to high-level decision-makers. A standardized Return on Investment (ROI) methodology provides the cross-departmental credibility necessary to defend procurement budgets and influence corporate strategy. Without a precision-engineered procurement ROI calculator template, leaders struggle to translate complex sourcing wins into the financial language the C-suite understands. Data-driven reporting creates a psychological shift in executive meetings, moving the discussion from simple expenditure to engineered value creation.
Procurement ROI vs. Operational Efficiency
Organizations often confuse operational efficiency with true ROI. Efficiency focuses on "doing things right," such as reducing the time spent on invoice processing. While AI-powered automation can drop invoice costs to under $1, it remains a baseline requirement rather than a strategic differentiator. ROI targets effectiveness, or "buying the right thing" at the most advantageous market position. To achieve maximum financial optimization, sophisticated departments utilize RFP Management as a strategic ROI multiplier. This approach ensures every sourcing event extracts clinical value instead of just fulfilling a requirement. It's the difference between a faster process and a more profitable outcome.
The Economic Impact of Unmanaged Spend
Unmanaged spend is a silent erosion of corporate capital that compromises the bottom line. In volatile markets, the "cost of doing nothing" is often the most expensive line item on the balance sheet. Hidden leakages in tail spend and non-compliant sourcing account for significant margin loss that remains invisible without a formal procurement ROI calculator template. Identifying baseline market pricing with clinical precision is the only method to stop this financial bleed. Consider these critical focus areas for spend recovery:
- Eliminating rogue spend through rigorous compliance tracking.
- Identifying pricing anomalies across fragmented or decentralized categories.
- Establishing real-time market benchmarks to prevent margin compression.
When these variables are quantified, procurement transforms from a support function into a high-powered engine for financial growth. The ability to present a defensible ROI model ensures that procurement is viewed as a strategic architect of the company's financial future rather than just a gatekeeper of costs.
The Mathematical Architecture of a High-Precision ROI Template
A high-precision procurement ROI calculator template must be anchored in the Source-to-Pay (S2P) value chain to ensure every financial touchpoint is captured. This architectural foundation moves beyond simple price comparisons by integrating direct costs, indirect overhead, and specific technology investments. For enterprise-level reporting, the model requires input variables that reflect the true cost of acquisition and management. This clinical approach allows procurement leaders to move beyond the simplistic formulas used by competitors and provide a comprehensive view of Maximizing Procurement ROI. By categorizing spend data with this level of granularity, you establish a defensible baseline for all subsequent financial claims.
Hard Savings: The Bottom-Line Metric
Hard savings represent the realized, P&L-impacting reductions in expenditure. The primary formula for this metric is the delta between the actual price paid and the historical baseline, adjusted for volume. It's not just about a lower unit price. You must factor in volume discounts and payment term optimizations that improve cash flow. To satisfy C-suite scrutiny, every claim within your procurement ROI calculator template needs audit-ready documentation. This includes signed contracts, baseline price verification, and validated consumption figures. Hard savings are the most respected metrics because they directly correlate with immediate margin expansion.
Cost Avoidance: Quantifying Preventative Value
Cost avoidance measures the value of mitigating price increases in volatile or inflationary environments. This is where clinical precision becomes vital. When market indices rise, simply maintaining a static price is a significant win. The formula compares the negotiated price against market-indexed price trending or the initial supplier bid. Using real-time market intelligence allows you to justify "avoided" costs that would have otherwise eroded margins. This metric is essential for reporting on Spend Under Management, as it demonstrates procurement's role in price risk mitigation. If you're unsure where your current model stands, a performance diagnostic can help identify gaps in your savings capture.
To ensure total financial accuracy, your ROI model should integrate the following variables:
- Direct Spend Realization: The measurable delta in raw material or inventory costs.
- Indirect Overhead Reduction: Savings found in services, utilities, and non-production categories.
- Technology Amortization: Factoring the cost of procurement software against productivity gains, which can reach 25% to 40% with the use of AI task-level tools.
Standard automation focuses on operational efficiency, but true financial optimization requires quantifying the effectiveness of the negotiation process itself. The "Negotiation Delta" represents the measurable gap between a supplier's initial bid and the final executed contract. This figure is a critical input for any sophisticated procurement ROI calculator template because it isolates the specific value added by procurement’s strategic intervention. By integrating Negotiation Coach logic into your ROI models, you move away from anecdotal success toward a clinical verification of negotiation prowess. This structured approach ensures that every percentage point shaved off a bid is accounted for as a direct contribution to corporate margin expansion.
The financial value of procurement extends deeply into contract compliance and vendor performance tracking. Non-compliance often leads to "leakage" where negotiated savings never actually materialize on the balance sheet. A risk-adjusted ROI model factors in these variables along with the potential cost of supply chain disruptions. By assigning a financial weight to supplier stability and delivery reliability, procurement professionals can demonstrate how their risk mitigation efforts protect the organization from catastrophic cost spikes. This level of analysis transforms the procurement function into a strategic architect of corporate resilience.
Benchmarking as an ROI Catalyst
Effective ROI reporting depends on the accuracy of your baselines. Using category cost benchmarking allows you to set aggressive yet realistic targets for your sourcing events. The ROI of Should-Cost Analytics is particularly high in complex RFP cycles, as it provides the granular data needed to challenge supplier pricing structures. This precision modeling ensures that your procurement ROI calculator template is based on market realities rather than arbitrary historical averages. It provides the mathematical leverage required to secure better terms during high-stakes vendor interactions.
Mitigating Financial Volatility
Calculating the ROI of price risk management services is essential for long-term enterprise planning. Price certainty acts as a hedge against market instability, allowing for more accurate budgeting and capital allocation. Forecasting isn't just a predictive exercise; it's a proactive tool for budget protection. When you quantify the value of avoiding price spikes through strategic hedging or contract indexing, you elevate procurement’s status to a high-level financial partner. This proactive stance ensures that the organization remains protected against the "legislative tsunami" of new due-diligence laws and shifting trade-weighted average tariff rates, which reached 17% in late 2025.
Step-by-Step: Constructing Your Enterprise ROI Model
Constructing a defensible enterprise model demands a methodical five-step process. First, you must execute rigorous data normalization to ensure baseline consistency across global spend. Without uniform data, your ROI claims will fail under audit. Second, apply category segmentation. This involves assigning different ROI weights to direct spend versus tail spend to reflect their varying impact on margin expansion. Third, integrate real-world market benchmarks into your procurement ROI calculator template. This step validates your negotiation success against external indices rather than internal guesses. Fourth, secure stakeholder validation. Gaining CFO buy-in on your calculation methodologies before presenting final results is critical for long-term credibility. You must align on the definitions of hard savings and cost avoidance to prevent friction during quarterly reviews. Finally, transition to iterative reporting. Static spreadsheets are obsolete; modern procurement requires dynamic analytics that reflect real-time market shifts and inflationary pressures.
Data Hygiene and Normalization
Data integrity is the non-negotiable foundation of any ROI model. You must eliminate duplicate vendor entries and rectify inconsistent unit-of-measure data that skews cost-per-unit analysis. Effective Category Management provides the clinical framework necessary to organize fragmented spend data into actionable insights. Automating data extraction reduces the high margin of error associated with manual entry. Manual invoice processing costs between $10 and $22 per invoice, making automation a direct contributor to the ROI you're trying to measure. Clean data ensures your model remains a reliable tool for high-level decision-making and strategic resource allocation.
Customizing the Template for Your Industry
A generic model lacks the precision required for specialized sectors. You must adjust ROI variables to account for industry-specific realities, such as high regulatory compliance costs in healthcare or raw material volatility in manufacturing. Building 'What-If' scenarios into your procurement ROI calculator template allows you to project the impact of future market price trends or tariff adjustments. This forward-looking capability transforms your reporting from a historical record into a strategic forecasting tool. It enables you to prepare for the legislative tsunami of ESG laws by quantifying the cost of supply chain traceability. To verify your model's architectural integrity, run a free performance diagnostic to identify potential spend leakages before they impact your annual reporting.
Driving Margin Expansion with RightCostIQ’s Analytical Ecosystem
The transition from a static procurement ROI calculator template to an automated analytical ecosystem represents the final stage of procurement maturity. While manual frameworks establish the necessary baseline for reporting, they often lack the real-time agility required to navigate 2026’s volatile market conditions. RightCostIQ’s ecosystem replaces fragmented spreadsheets with integrated procurement intelligence, ensuring that every sourcing event is anchored in clinical data. This shift allows high-level decision-makers to move beyond historical analysis and embrace predictive financial optimization. By centralizing cost benchmarking and vendor performance tracking, organizations can achieve a level of margin expansion that manual processes simply cannot support.
The ROI of Professional RFP Management
Expert negotiation support acts as a force multiplier for internal procurement teams. RightCostIQ’s RFP Management Solutions deliver immediate ROI by reducing sourcing cycle times and enforcing clinical execution. Case study data indicates that procurement functions utilizing advanced analytical assistance can reduce overall costs by 15% to 45%, depending on the category. This isn't merely about lower unit prices. It's about the clinical quantification of value through professional bid analysis and strategic vendor selection. Expert support ensures that the "Negotiation Delta" identified in your procurement ROI calculator template is maximized in every contract, leaving no capital on the table during high-stakes interactions.
Empowering the Strategic Architect
The ultimate objective of a precision-engineered ROI framework is to redefine the procurement leader as a strategic architect. You’re no longer an administrator managing transactions; you’re a value creator driving the company’s financial future. Leveraging market price trending and forecasting services allows for proactive budget protection rather than reactive cost-cutting. This forward-looking approach is essential as 70% of companies are expected to integrate complex ESG metrics into their supplier scorecards by late 2026. Predictive procurement ensures your department remains ahead of these regulatory shifts while maintaining a relentless focus on the bottom line.
Modern financial optimization requires a synergy between cost benchmarking and negotiation assistance. By integrating real-time market indices into your daily operations, you protect the organization from price risk and inflationary spikes. It’s time to move beyond the limitations of manual tracking and secure the future of your organization's financial health. Optimize Your Procurement ROI with RightCostIQ today and transform your department into a primary driver of corporate growth and operational excellence.
Institutionalizing Clinical Financial Precision in Procurement
The evolution of procurement into a primary driver of margin expansion requires more than just operational efficiency; it demands a clinical approach to value quantification. By establishing a rigorous mathematical architecture and focusing on the negotiation delta, your department transitions from a support function to a strategic architect of corporate resilience. Deploying a precision-engineered procurement ROI calculator template ensures that every sourcing event is backed by defensible data and market-indexed benchmarks. This framework provides the transparency necessary to secure C-suite buy-in and protect against the volatility of shifting global trade rates.
RightCostIQ offers the advanced tools needed to move beyond static spreadsheets and embrace predictive procurement intelligence. Our specialized healthcare financial analytics expertise and clinical RFP management frameworks ensure your organization captures maximum value in every category. With proprietary market price trending models, we provide the foresight required to mitigate price risk before it impacts your bottom line. It's time to institutionalize financial precision and lead your department toward a future of engineered growth.
Execute Your Procurement Strategy with RightCostIQ
Frequently Asked Questions
What is the difference between Hard Savings and Cost Avoidance in procurement ROI?
Hard savings represent measurable reductions in expenditure that directly impact the profit and loss statement, such as a lower unit price compared to the historical baseline. Cost avoidance refers to actions that prevent future price increases, such as negotiating a lower rate than the current market index or initial supplier bid. While hard savings improve current margins, cost avoidance protects future budgets from inflationary pressure and market volatility.
How do I include 'Tail Spend' in my ROI calculator template?
You include tail spend by applying specific ROI weights to non-core categories that often escape rigorous management. Integrating these low-value, high-volume transactions into your procurement ROI calculator template allows you to identify hidden leakages and non-compliant sourcing. This process captures incremental gains that, when aggregated across the organization, contribute significantly to overall margin expansion and operational efficiency.
What are the most important KPIs to include in a procurement ROI model?
The most critical KPIs are Spend Under Management (SUM), Hard Cost Savings, Cost Avoidance, and the Negotiation Delta. Tracking the Procurement ROI per Category provides granular visibility into where the department is delivering the highest financial impact. These metrics ensure that procurement's performance is reported in the clinical financial language required for C-suite presentations and strategic planning.
How can I quantify the value of supplier risk management?
Quantifying risk management involves calculating the potential financial impact of supply chain disruptions and assigning a probability-weighted cost to those events. You factor in variables such as supplier financial stability and shipping route reliability to create a risk-adjusted ROI. This approach demonstrates how proactive risk mitigation protects corporate capital from catastrophic cost spikes and legislative penalties.
Should I use a spreadsheet or a dedicated procurement platform for ROI tracking?
Dedicated procurement platforms are superior for enterprise-level tracking due to their ability to provide real-time benchmarking and reduce manual data entry errors. While a manual procurement ROI calculator template serves as a foundational framework, automated platforms offer the clinical precision needed for high-stakes decision-making. Transitioning to a digital ecosystem ensures your data remains audit-ready and reflects current market indices.
How often should procurement ROI reports be presented to the C-suite?
ROI reports should be presented quarterly to align with standard corporate financial cycles and board reviews. High-growth organizations or those in volatile sectors often benefit from monthly reporting to maintain strategic urgency. Regular reporting ensures that procurement remains a visible driver of financial growth rather than a misunderstood support function.
Can negotiation assistance be factored into a standard ROI template?
Negotiation assistance is a primary input for the Negotiation Delta metric, which measures the gap between an initial supplier bid and the final contract price. Isolating this delta allows you to quantify the specific financial value added by strategic intervention. Including these results in your model provides a clinical verification of procurement's effectiveness in extracting maximum value from every sourcing event.
What is the industry average for procurement ROI?
High-performing procurement functions typically target a return on investment between 5:1 and 10:1, though this fluctuates based on category complexity and organizational maturity. Organizations leveraging AI-powered analytics often see productivity gains of 25% to 40%, which significantly elevates the total ROI. Your specific average will depend on the clinical execution of your sourcing strategy and the accuracy of your benchmarking data.