
What if a procurement ROI claim looked impressive in a presentation but couldn’t withstand a finance review? If you’re asking how to measure procurement ROI, the challenge isn’t finding a formula. It’s building a defensible calculation from reliable baselines, attributable results, and clearly defined costs. Cost avoidance is especially difficult to substantiate when stakeholders can’t see what would have happened without procurement’s intervention.
A credible framework separates realized hard savings from validated cost avoidance and operational benefits. It also accounts for the full cost of procurement and prevents the same value from being counted twice. Without consistent benchmarks and disciplined tracking, strong performance can be obscured by manual processes or overstated through inconsistent assumptions.
This article provides a repeatable method to calculate and report procurement ROI, with a practical formula, benchmarking guidance, and a clear distinction between hard and soft savings. You’ll also learn how to quantify efficiency and risk benefits without presenting unverified value as realized savings. The result is a more credible view of procurement’s contribution, aligned with corporate financial goals and grounded in market data, cost analysis, and measurable outcomes.
Key Takeaways
- Learn how to measure procurement ROI with a repeatable calculation that connects procurement impact to the function’s cost.
- Distinguish realized financial savings from cost avoidance, and apply clear evidence standards when reporting each to finance stakeholders.
- Use category cost benchmarks and market data to build credible baselines and strengthen the accuracy of ROI claims.
- Track vendor performance and contract compliance to identify whether sourcing outcomes deliver sustained value.
- Assess how disciplined RFP management and negotiation assistance can improve procurement outcomes and financial alignment.
Defining the Strategic Framework for Procurement ROI
Procurement ROI measures the financial benefit generated by procurement relative to the full cost of operating the function. This multidimensional metric can include hard savings, cost avoidance, and operational efficiency. Separating realized financial impact from future value and unquantified improvements helps leaders avoid treating every benefit as a realized return.
Tactical savings focus on a price reduction or negotiated discount. Strategic value creation asks whether an outcome improved total cost, reduced exposure to price or supplier risk, or made purchasing more efficient. Strategic Sourcing provides useful context: decisions extend beyond purchase price to consider broader costs and continuous improvement.
The ROI Formula for Strategic Procurement
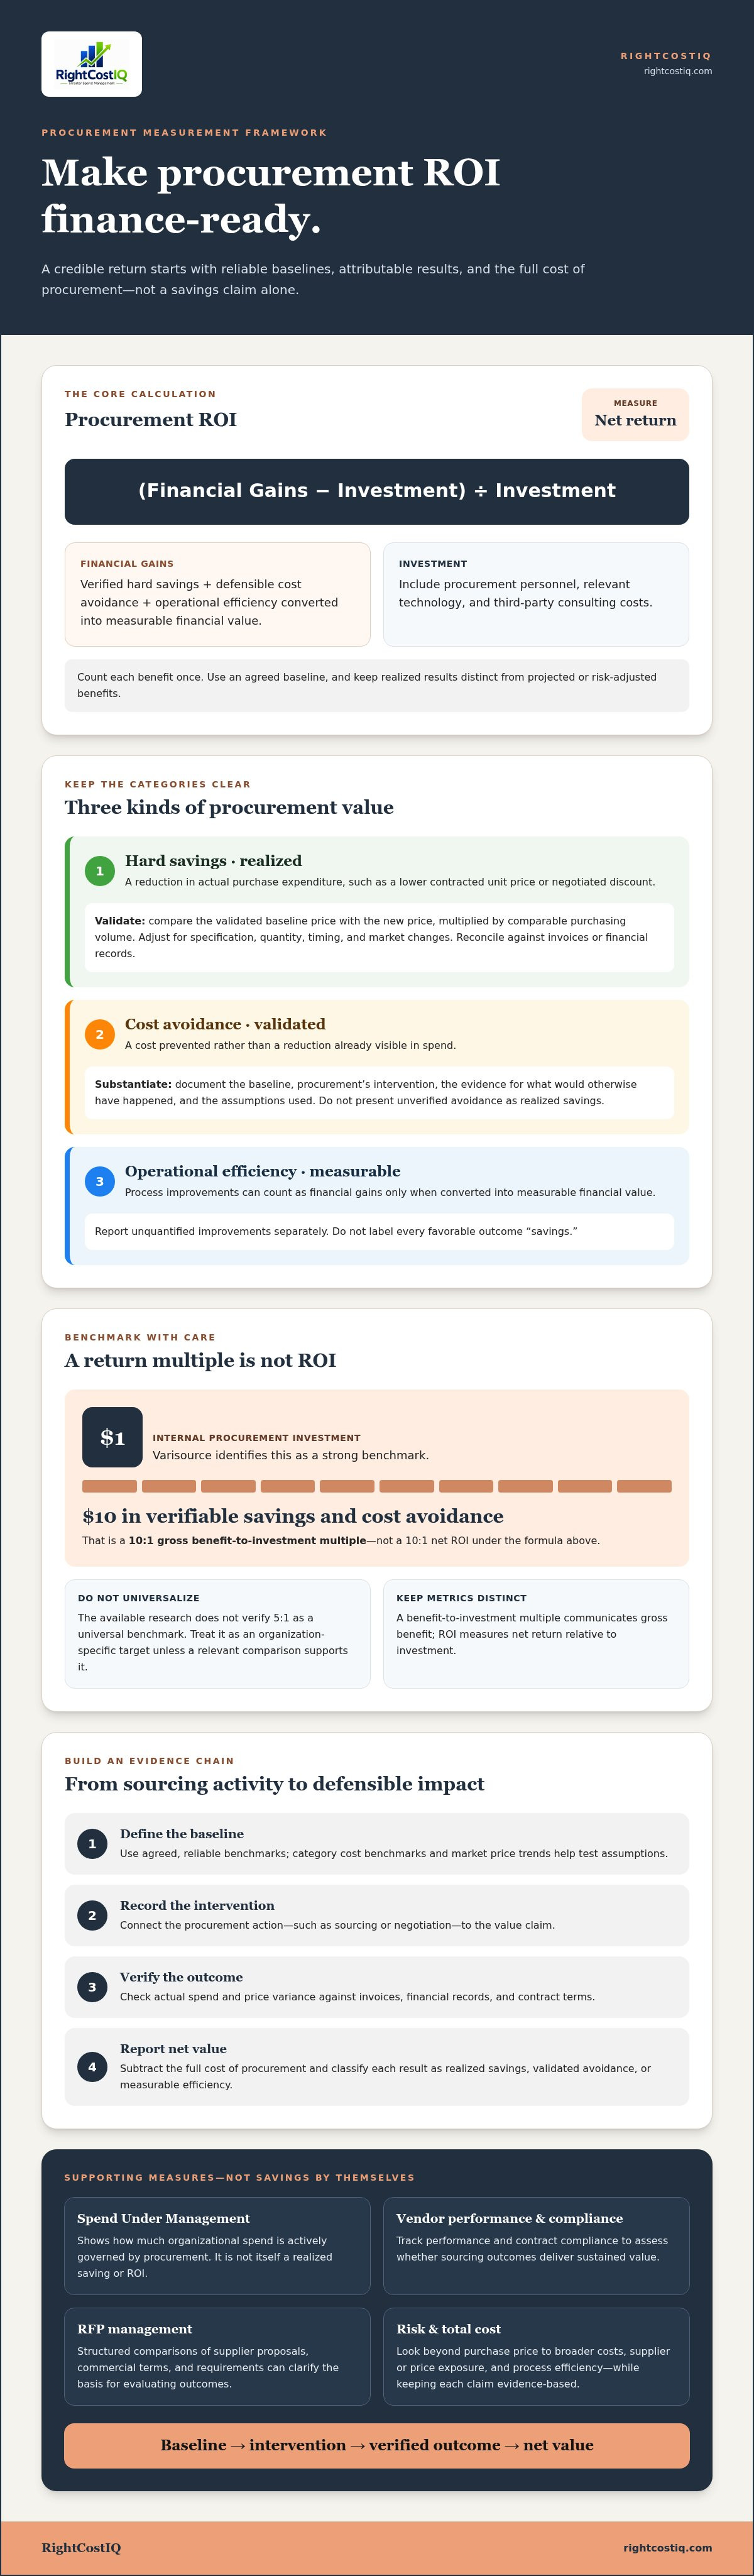
Start with the standard calculation: (Financial Gains - Investment) / Investment. Financial gains can include verified hard savings, defensible cost avoidance, and operational efficiency converted into measurable financial value. Count each benefit once, use an agreed baseline, and distinguish realized results from projected or risk-adjusted benefits.
Define investment comprehensively. Include procurement personnel costs, relevant technology costs, and third-party consulting costs. Excluding these inputs can inflate the return and weaken credibility with finance stakeholders. The resulting percentage shows net return relative to investment. A separate benefit-to-investment multiple can make the scale easier to communicate.
Benchmark claims require precision. Varisource identifies a 10:1 return on internal procurement investment as a strong benchmark, expressed as $10 in verifiable savings and cost avoidance for each $1 invested. That is a gross benefit-to-investment multiple, not a 10:1 net ROI under the formula above. The available research does not verify 5:1 as a universal benchmark, so treat it as an organization-specific target unless a relevant comparison supports it.
Shifting from Tactical Savings to Strategic Architecture
Procurement has moved beyond a back-office purchasing role. It is increasingly expected to influence financial performance through sourcing decisions, supplier terms, risk oversight, and process efficiency. Meeting that expectation requires an evidence chain: define the baseline, record the intervention, verify the outcome, and report net value against procurement’s full cost.
RFP management can establish a structured comparison of supplier proposals, commercial terms, and requirements, creating a clearer basis for evaluating outcomes. Category cost benchmarking and market price trending help test assumptions against market conditions. Vendor performance tracking can then show whether agreed outcomes hold after award. To assess how to measure procurement ROI, connect each claim to its source data and classify it as realized savings, validated avoidance, or measurable efficiency.
Quantifying Hard Savings vs. Strategic Cost Avoidance
Procurement value is easy to overstate when every favorable outcome is labeled “savings.” A finance-ready model separates results already reflected in spend from costs that were avoided, then records the evidence and assumptions behind each claim. Measuring procurement ROI is a question of attribution and verification, not just price comparison.
Hard Savings: The P&L Impact
Hard savings are realized reductions in purchase costs, such as a lower contracted unit price or a negotiated discount that reduces actual expenditure. A basic calculation compares the validated baseline price with the new price, multiplied by comparable purchasing volume. Adjust for changes in specification, quantity, timing, and market conditions so the reported result reflects procurement’s impact rather than unrelated spend changes.
Use price variance to monitor the difference between baseline and paid prices, and reconcile claimed savings against invoices or financial records before reporting a P&L benefit. Procurement analytics can help identify leakage, such as purchases outside negotiated agreements or realized prices that differ from contracted terms. Spend Under Management is a useful supporting metric: it shows how much organizational spend is actively governed by procurement, but it is not itself a realized saving or ROI.
Cost Avoidance: The Strategic Shield
Cost avoidance is an evidence-based estimate of future expense prevented. It may include limiting a proposed price increase or securing value-add services without an equivalent increase in contract cost. Because avoided spend doesn’t appear as a direct reduction in historical expenditure, report it separately from hard savings. Document the supplier’s original proposal, the final terms, the comparison period, and the assumptions used to calculate the avoided amount.
Market price trending helps test whether an avoided increase was plausible. Compare the supplier’s proposed change with relevant market movement over the same period, using comparable categories and specifications. If the final price rises less than a well-supported market benchmark, procurement may have “beaten the market.” Show the reference data and avoid treating the entire difference as realized savings.
Price risk management adds another measurable dimension. Track exposure to market movements, contract protections secured, and outcomes against a defined benchmark. Negotiation assistance can support review of pricing mechanisms, renewal language, and other terms that may create future cost exposure. For relevant negotiations, negotiation assistance can help teams evaluate terms systematically. Include only benefits supported by documented evidence, and keep projected risk reduction distinct from financial gains already realized.
Benchmarking and Analytics: The Foundation of Accurate Measurement
An ROI calculation is only as credible as its baseline. Without a reliable reference for what a category should cost, a lower purchase price may reflect a sourcing gain, a specification change, a volume shift, or a broader market decline. Benchmarking helps distinguish procurement’s contribution from external factors and makes performance claims more defensible.
Leveraging Category Cost Benchmarking
Category cost benchmarking compares internal purchase costs with relevant market pricing. Start by aligning specifications, quantities, delivery terms, geography, and time periods. Compare internal prices with the available market reference, then document differences that could affect the result. A benchmark is not a target by itself. It is a controlled point of comparison for identifying gaps and testing sourcing opportunities.
This analysis can reveal potential “low-hanging fruit,” such as categories priced materially above comparable market references, fragmented demand, or inconsistent supplier terms. Treat these as investigation priorities, not guaranteed savings. Connect each opportunity to business requirements, supplier conditions, and a measurable outcome. A structured category management framework helps align sourcing decisions with wider financial priorities instead of optimizing price in isolation.
Market Price Forecasting as a Negotiation Lever
Historical benchmarks show where costs stand. Market price trending and forecasting help assess where they may move. Procurement teams can use relevant trend data to time an RFP, evaluate supplier proposals, and distinguish a market-driven increase from a negotiable premium. Forecasts are directional inputs, not proof of future savings, so record the assumptions and refresh them as conditions change.
Proactive price risk management can help teams identify exposure and assess contract terms before a price movement affects spend. For example, if market indicators suggest upward pressure, a team can evaluate available pricing structures and compare supplier proposals against the same category assumptions. A should-cost analysis can provide an additional reference point for testing whether a quoted price aligns with its cost drivers. Use it alongside market benchmarks, not as a substitute for comparable data.
Measurement must continue after contract award. Vendor performance tracking links the negotiated outcome to actual purchasing behavior by checking whether prices, terms, and service commitments are followed. This closes the execution gap between a sourcing event and realized value. To measure procurement ROI accurately, pair benchmarked category results with documented contract performance. Report deviations as leakage, validated gains, or unresolved variance rather than blending them into one savings figure.
A Methodical Process for Measuring Procurement Impact
Reliable procurement ROI depends on a repeatable measurement process, not a year-end estimate assembled from disconnected spreadsheets. Build an evidence trail from the initial cost baseline through contract execution, then reconcile claimed benefits against actual purchasing and finance data. This helps separate procurement’s contribution from market shifts, specification changes, and volume fluctuations.
Establishing the Baseline and Tracking Compliance
Historical spend shows what the organization paid, but it can’t establish what comparable purchases should cost under current market conditions. Use historical transactions alongside category benchmarks and relevant market data. Normalize for specifications, volume, timing, and commercial terms before comparing results. This gives each sourcing initiative a defensible reference point.
After award, vendor performance tracking can help identify whether suppliers and internal buyers follow agreed pricing and contract terms. Monitor a focused set of KPIs:
- Contract compliance rate: the share of relevant purchases made in line with contracted terms.
- Price variance: the difference between benchmark or contracted prices and actual paid prices.
- Cycle time: elapsed time across defined procurement stages, tracked consistently to identify process delays or efficiency gains.
These measures expose savings leakage and execution issues. A negotiated rate has limited value if actual transactions don’t reflect it.
Quantify, Validate, and Report
Calculate direct financial savings from verified price and volume data. Assess operational efficiency separately, using documented changes in process time or effort and a clear method for translating those changes into financial value. Avoid double counting: if faster processing already contributes to a quantified labor benefit, don’t add the same hours again under another efficiency measure.
Before reporting, reconcile procurement calculations with finance records and have the methodology reviewed. Procurement analytics can provide an additional validation layer for benchmarks, attribution, and calculation consistency. Record the data source, comparison period, assumptions, and whether each benefit is realized, avoided, or operational.
For the C-suite, lead with net contribution and the ROI calculation, then show the drivers and exceptions. Visual analytics can make price variance, compliance trends, cycle time, and spend under management easier to interpret across categories. Spend under management adds enterprise context by showing the share of spend actively governed by procurement; present it as a coverage indicator, not as a saving by itself. A clear report helps leaders see both the financial result and the controls that sustain it.
To strengthen procurement ROI measurement, standardize the baseline, KPI definitions, and validation steps before the next sourcing cycle begins.
Optimizing ROI Through Professional RFP Management and Negotiation
A competitive sourcing event can create value beyond the award decision. A structured RFP establishes comparable proposals, documented requirements, and a defensible basis for evaluating price and contract terms. To measure its contribution to long-term ROI, track the path from sourcing baseline to negotiated agreement and actual supplier performance. The process delivers lasting value only if contracted outcomes are realized after award.
The ROI of Structured RFP Execution
Professional RFP management strengthens the evidence behind sourcing decisions. Define requirements clearly, evaluate supplier responses against consistent criteria, and record how commercial terms compare with the baseline. Then verify negotiated prices against actual purchases. This approach doesn’t guarantee savings; it makes financial outcomes attributable, auditable, and less vulnerable to inconsistent comparisons.
Structured sourcing can also reduce process and supplier risk. Documented evaluation criteria and a consistent review process help teams assess proposals systematically, while clear requirements make it easier to identify gaps before award. Track cycle time and contract compliance alongside realized savings so efficiency gains and execution quality remain visible. RFP management can support a disciplined lifecycle, from requirements and supplier responses through negotiation and outcome measurement.
Negotiation assistance can help teams examine pricing mechanisms, renewal conditions, and other commercial terms, particularly in high-value procurements. Measure its impact against the initial proposal and a relevant benchmark, then distinguish realized reductions from avoided increases or risk exposure. RightCostIQ connects RFP management and negotiation with cost benchmarking, market price trends, and performance tracking.
Addressing Tail Spend for Margin Expansion
Tail spend refers to fragmented purchasing activity that receives less strategic oversight than core categories. Its ROI potential depends on the organization’s spend profile, data quality, and the cost of managing each opportunity, so don’t assume a fixed share of total spend is available as savings. Start by identifying recurring purchases, supplier overlap, off-contract transactions, and categories where inconsistent terms may be driving avoidable cost or effort.
Supplier consolidation may improve visibility and negotiating leverage, but it should follow analysis of business needs, service requirements, and supply risk. Compare the expected benefit with transition and administration effort, and consolidate only where the net case is positive. Apply the same disciplined baseline and post-award tracking used for larger sourcing events.
Measuring procurement ROI in RFPs and tail spend comes down to verified outcomes net of the effort and costs required to achieve them. Integrate category benchmarks, negotiated terms, supplier performance, and financial validation into one measurement process. That connection turns individual sourcing events into a sustained view of procurement’s contribution to financial performance.
How to Measure Procurement ROI and Turn Measurement Into Strategic Momentum
A credible procurement ROI case starts with a complete view of investment and benefits, not a savings figure in isolation. Separate realized hard savings from cost avoidance, use relevant benchmarks to validate the baseline, and track whether negotiated terms hold after award. Together, these practices help finance leaders assess procurement’s contribution with greater confidence.
Knowing how to measure procurement ROI also means connecting sourcing activity to lasting financial performance. RightCostIQ supports this work with cost benchmarking and analytics, negotiation assistance, and vendor performance and price risk tracking. These services help teams evaluate opportunities, monitor execution, and strengthen the evidence behind reported outcomes.
Optimize your procurement ROI with RightCostIQ’s RFP management and procurement analytics. Build a repeatable measurement approach, clarify procurement’s financial contribution, and assess the value your team creates.
Frequently Asked Questions
How do you calculate procurement ROI for indirect spend?
Calculate indirect-spend ROI by comparing verified financial gains with the full investment required to achieve them: (financial gains − investment) / investment. Establish a comparable baseline using historical transactions and category market benchmarks, then account for differences in specifications, volume, timing, and contract terms. Include procurement personnel, technology, and relevant consulting costs. To measure procurement ROI accurately, report hard savings, cost avoidance, and efficiency gains separately.
What is the difference between cost savings and cost avoidance in ROI?
Cost savings are reductions in actual expenditure, such as paying a lower contracted price for comparable goods or services. Cost avoidance is a documented expense prevented, such as negotiating a smaller increase than the supplier proposed. Savings can be validated against invoices or financial records; avoidance requires evidence of the credible alternative cost and the assumptions behind it. Report each separately so projected or prevented costs aren’t presented as realized P&L savings.
How much should a company invest in procurement technology to see ROI?
There’s no universal investment amount that guarantees procurement technology ROI. Estimate total cost of ownership, including implementation, ongoing technology expenses, and staff time, then compare it with benefits the organization can verify, such as reduced process effort, improved contract compliance, or realized savings. Define a baseline and success measures before investing. A phased approach can help validate data quality, adoption, and measurable results before expanding deployment.
What are the most important KPIs for measuring procurement performance?
Prioritize KPIs that connect procurement activity to financial outcomes and execution. Useful measures include verified hard savings, documented cost avoidance, contract compliance rate, price variance against a relevant benchmark, procurement cycle time, and spend under management. Use a consistent definition and data source for each metric. Spend under management indicates procurement’s coverage of organizational spend; it isn’t a saving by itself. Pair it with realized outcomes to assess impact.
How does market price volatility impact procurement ROI measurements?
Market volatility can make a simple before-and-after price comparison misleading. Prices may fall or rise independently of procurement’s actions, so compare results with relevant market trends over the same period and use like-for-like specifications, volumes, and terms. Record the benchmark and assumptions used. Market price trending and forecasting can inform RFP timing and negotiations, while price risk tracking helps distinguish procurement’s contribution from broader market movement.
Can vendor performance tracking be quantified as a financial return?
Yes, when tracking links supplier performance to verifiable financial outcomes. Compare contracted prices and terms with actual transactions to identify savings leakage, off-contract purchases, or price variance. Quantify efficiency only when the improvement is measurable and translated using an agreed method. Track service or compliance indicators separately unless their financial effect can be substantiated. Vendor performance tracking supports ROI measurement, but the tracking activity alone isn’t a financial return.
How do you justify the cost of procurement consulting services like RightCostIQ?
Justify consulting investment by defining the business problem, baseline, expected outcomes, and full engagement cost before work begins. Then compare validated results with that investment, separating realized savings from cost avoidance and operational benefits. RightCostIQ provides RFP management and negotiation assistance, category cost benchmarking and analytics, and vendor performance and price risk tracking. Assess these services against relevant sourcing needs and verify results with consistent market and financial data.
What is a good benchmark for procurement ROI in the healthcare industry?
A healthcare-specific procurement ROI benchmark isn’t established by the information available here, so avoid applying a general figure as if it were sector-specific. Varisource identifies a 10:1 return on internal procurement investment as a strong general benchmark, based on verifiable savings and cost avoidance. Treat it as a comparison point, not a guaranteed target. Validate your organization’s result against its spend profile, procurement costs, category data, and accounting practices.


