
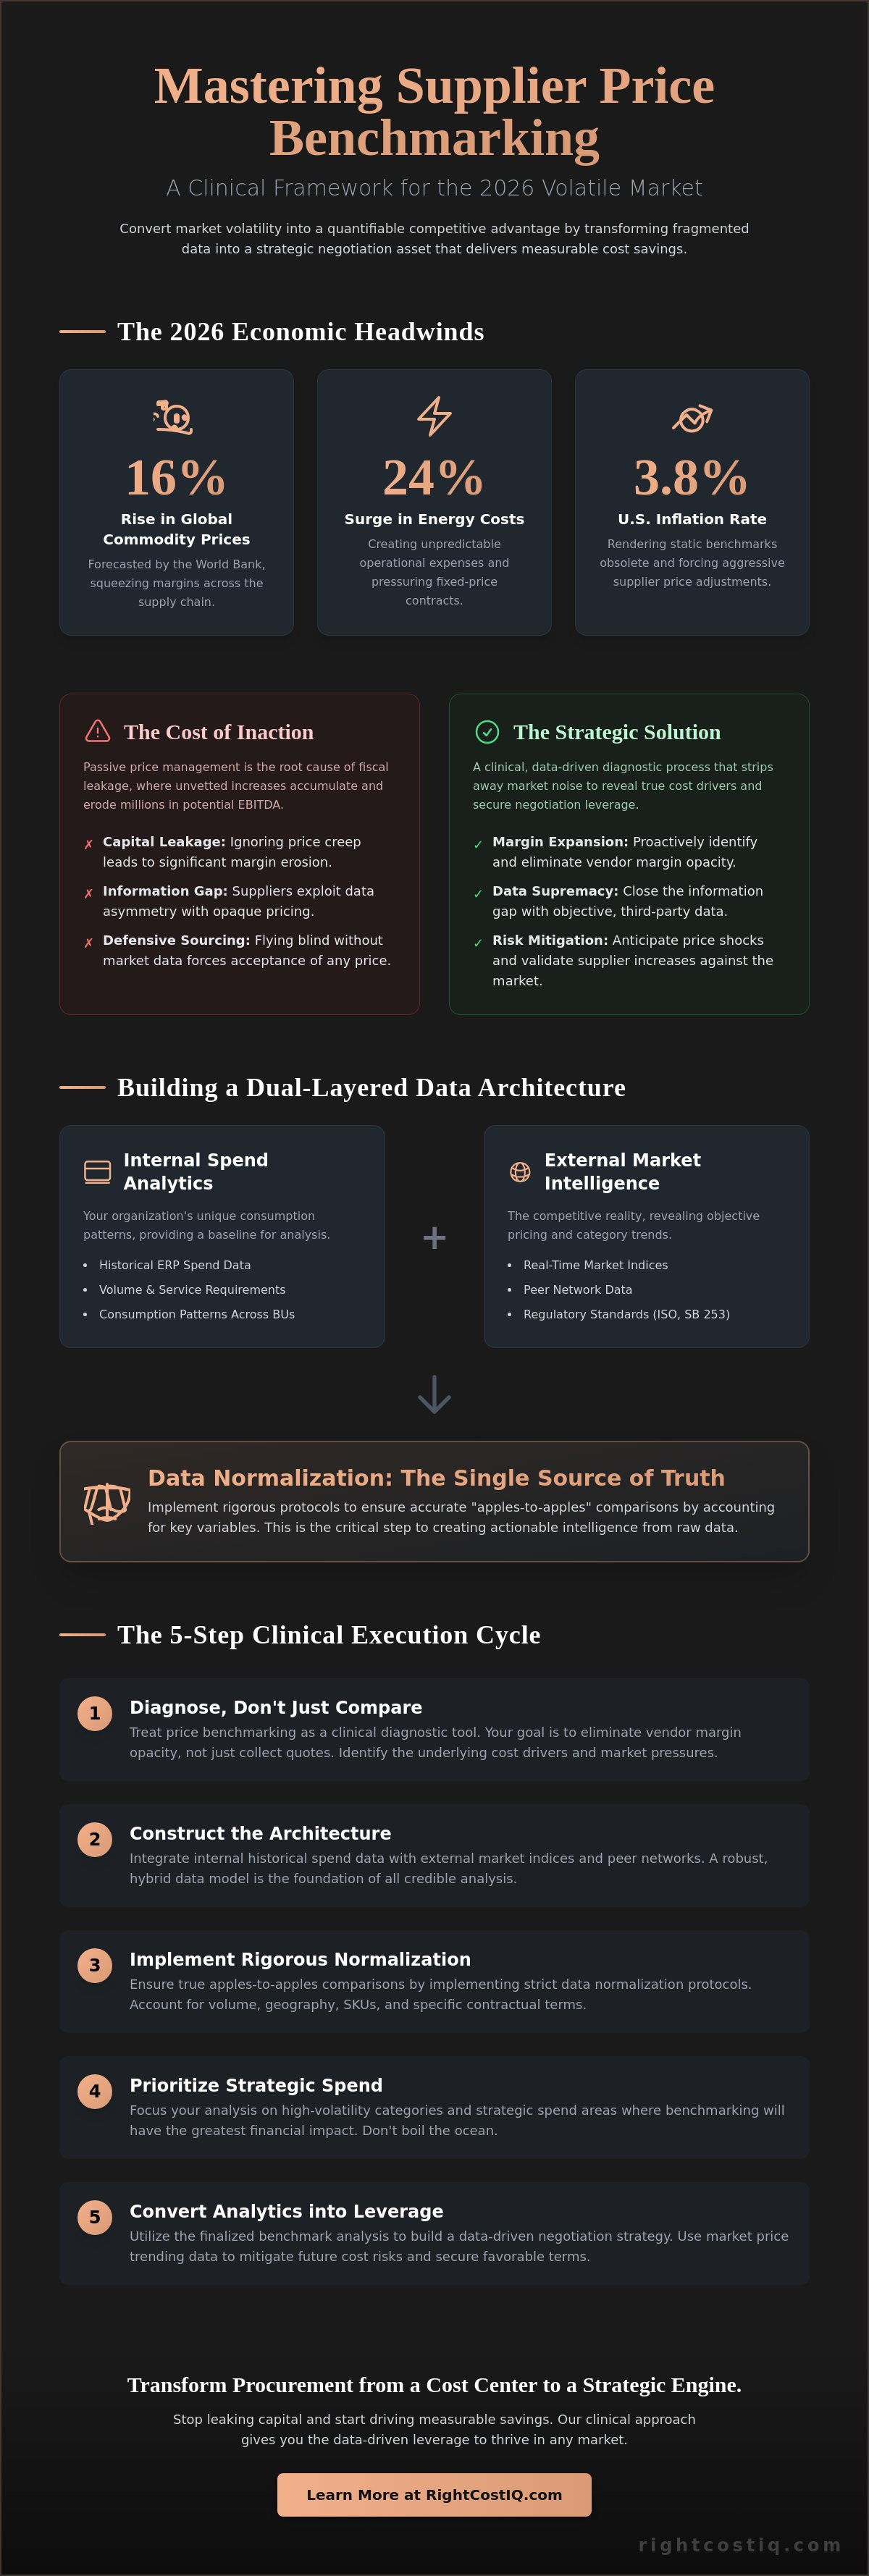
With the World Bank forecasting a 16% rise in global commodity prices for 2026 and energy costs surging by 24%, your current procurement contracts are likely leaking capital. U.S. inflation reached 3.8% in April 2026, which means static benchmarks from even six months ago are now functionally obsolete. You've likely dealt with opaque supplier models and inconsistent data across business units that obscure the true market rate. Mastering how to benchmark supplier pricing is no longer a periodic administrative task; it's a critical diagnostic process required to maintain professional-grade operational efficiency.
You'll learn a data-driven, repeatable methodology to identify price variance and secure maximum leverage during your next renewal cycle. We're providing a clinical framework that integrates real-time market intelligence and the updated ISO 14001:2026 standards to ensure your supply chain remains resilient. This guide moves from broad strategic promises to granular technical execution, giving you the tools to convert market volatility into a quantifiable competitive advantage. We'll examine how to transform fragmented data into a strategic negotiation asset that delivers measurable cost savings.
Key Takeaways
- Eliminate vendor margin opacity by treating price benchmarking as a clinical diagnostic tool rather than a simple quote comparison.
- Construct a robust benchmarking architecture by integrating internal historical spend data with external market indices and peer networks.
- Implement rigorous data normalization protocols to account for volume, geography, and contractual terms, ensuring accurate apples-to-apples comparisons.
- Master how to benchmark supplier pricing through a structured selection process that prioritizes high-volatility categories and strategic spend.
- Convert benchmarking analytics into negotiation leverage and utilize market price trending to mitigate future cost risks.
The Strategic Necessity of Supplier Price Benchmarking in 2026
In the current fiscal environment, supplier price benchmarking has evolved from a periodic administrative task into a clinical procurement exercise. It serves as a rigorous diagnostic process designed to strip away market noise and reveal the underlying cost drivers of your supply chain. High-level decision-makers recognize that benchmarking is no longer optional; it's the primary mechanism for enterprise margin expansion in an era of extreme volatility. When you master how to benchmark supplier pricing, you transform procurement from a back-office function into a strategic engine for financial growth.
Vendors historically maintain their margins by exploiting an "Information Gap." This asymmetry occurs when suppliers possess real-time market intelligence that procurement teams lack, allowing them to present opaque pricing models that mask significant markups. By the time you reach the negotiation table, the vendor often has the data advantage. Professional-grade benchmarking closes this gap by providing objective, third-party data points that force transparency. This shift is critical as the World Bank forecasts a 16% rise in global commodity prices throughout 2026, with energy costs already jumping 17.9% year-over-year as of April 2026.
The 2026 market has rendered traditional fixed-price contracts increasingly risky. With U.S. inflation hitting 3.8% in early 2026, suppliers are aggressively pushing for price adjustments to cover their own rising input costs. Without a data-driven framework, your organization is forced to accept these hikes at face value. A clinical approach to benchmarking allows you to validate whether a requested increase aligns with actual market trending or if it's merely an attempt to pad supplier profits at your expense.
The Consequences of Passive Price Management
Passive price management is the root cause of fiscal leakage. When procurement teams fail to monitor price creep, small, unvetted increases accumulate across categories, eroding millions in potential EBITDA. This lack of oversight leads to "defensive" sourcing, where the goal is merely to maintain supply rather than optimize value. Without understanding how to benchmark supplier pricing against current market indices, you're effectively flying blind, ignoring category-specific trends that could provide significant negotiation leverage.
Benchmarking as a Risk Mitigation Tool
Modern procurement analytics prioritize proactive risk management. Data-driven insights protect the enterprise against supplier-driven price shocks by identifying outliers before they impact the bottom line. This "clinical execution" involves using market price trending and forecasting to anticipate shifts in the supply chain. By integrating these metrics into your vendor performance tracking, you create a resilient architecture that favors objective performance over historical relationships, ensuring every dollar spent is optimized for the current 2026 economic reality.
Establishing the Benchmarking Architecture: Internal vs. External Data
A clinical procurement framework demands a dual-layered data architecture. Internal historical spend data provides a baseline of your organization’s unique consumption patterns, while external market indices reveal the competitive reality. Relying solely on internal data creates a vacuum that ignores the 3.8% inflation rate reported in April 2026. Conversely, external data without internal context lacks the nuance of your specific volume and service requirements. High-stakes category management requires a hybrid approach that synthesizes these two streams into a single source of truth.
Technical infrastructure is the backbone of this process. You must establish a centralized repository capable of capturing and storing comparable pricing data across all business units. This system should account for the new regulatory landscape, including the California Emissions Reporting (SB 253) requirements and the updated ISO 14001:2026 standards. These factors now influence total cost of ownership and must be integrated into your procurement category cost benchmarking and analytics to maintain a competitive advantage.
Leveraging Internal Spend Analytics
Extracting "clean" pricing data from ERP systems is the first technical hurdle. Raw data often contains noise like shipping fees or one-time surcharges that distort the actual unit price. Conducting a granular spend analysis is the most efficient way to identify internal price variance across different business units. Internal benchmarking serves as the immutable baseline for all subsequent external comparisons.
Acquiring External Market Intelligence
External intelligence requires a diversified sourcing strategy. Professional procurement teams utilize data aggregators, peer networks, and real-time results from professional RFP management to build a comprehensive competitive analysis framework. Weighting this data is critical; a quote from a high-volume RFP conducted last month carries more strategic weight than a generic market index from six months ago. Timeliness is the primary linguistic anchor of your strategy. You need to ensure your external data reflects the 17.9% jump in U.S. energy costs seen in early 2026 to avoid negotiating from a position of weakness. By utilizing a price risk management and tracking service, you can ensure your external intelligence remains current and actionable.
Effective architecture doesn't just store data; it prepares it for clinical execution. This involves aligning your internal cost structures with broader market price trending and forecasting service data. When these elements are perfectly aligned, you eliminate the information gap that vendors use to maintain their margins. This systematic approach ensures that every negotiation is backed by verified, real-time intelligence rather than historical assumptions.
Data Normalization: Ensuring "Apples-to-Apples" Price Comparisons
Raw price comparisons are fundamentally deceptive. If you analyze two quotes side-by-side without adjusting for operational variables, you are committing a strategic error that leads to faulty procurement decisions. Data normalization is the clinical process of mathematically adjusting price points to account for variance in volume, logistics, and contractual terms. Mastering how to benchmark supplier pricing requires this level of analytical rigor to strip away the noise that vendors utilize to obscure their true margins. Without normalization, your benchmarking efforts will fail to provide the quantifiable cost savings your organization demands.
Clinical precision is required to adjust for macro-economic shifts. With U.S. inflation at 3.8% as of April 2026 and energy costs surging by 17.9%, a benchmark from even three months ago is functionally obsolete unless normalized for these fluctuations. "Hidden cost" factors, including shipping surcharges, payment terms, and specific service level agreements (SLAs), frequently account for a significant portion of total spend. You must isolate these variables to ensure your baseline reflects the true market rate. This diagnostic approach transforms fragmented data into a strategic negotiation asset.
Volume and Geographic Adjustments
Economies of scale must be factored into every benchmarking model. A quote for 10,000 units cannot be compared directly to a quote for 1,000 units without applying a volume-sensitivity multiplier. Geography also dictates the final "landed price." Regional logistics costs, transport reliability, and local labor rates vary significantly. Professional procurement teams identify specific geographic multipliers to account for these variances, ensuring that a price point from a near-shored supplier is weighted correctly against a global alternative. This ensures your procurement category cost benchmarking and analytics remain accurate across diverse business units.
Total Cost of Ownership (TCO) vs. Unit Price
Focusing solely on unit price is a critical procurement failure that ignores the long-term fiscal impact of a contract. A low unit price often masks high maintenance costs, disposal fees, or excessive administrative overhead. A robust benchmarking framework weights TCO factors, such as the cost of compliance with the updated ISO 14001:2026 environmental standards or the administrative burden of reporting Scope 1 and 2 emissions. To achieve maximum leverage, your model must include:
- Operational Maintenance: Expected lifecycle costs and repair frequencies.
- Regulatory Compliance: Costs associated with meeting new federal and state-level mandates.
- Administrative Overhead: The internal resources required to manage the vendor relationship and performance tracking.
By normalizing your data through these lenses, you move from surface-level observation to a clinical diagnostic. This ensures that when you utilize a price risk management and tracking service, your comparisons are based on hard, adjusted data that a supplier cannot easily dismiss during high-stakes negotiations.
A Step-by-Step Execution Guide for Pricing Benchmarking Cycles
Strategic procurement optimization requires a continuous execution cycle rather than a fragmented, one-off analysis. This clinical approach ensures that your organization remains agile in a market where energy costs surged by 17.9% in early 2026. Mastering how to benchmark supplier pricing necessitates a structured five-step methodology that converts raw market intelligence into actionable negotiation leverage.
Step 1: Category Selection. Efficiency begins with prioritization. You must identify categories where market volatility or high spend volume creates the greatest risk of fiscal leakage. Step 2: Data Collection. Assemble granular internal spend profiles and cross-reference them with external market indices. Step 3: Clinical Analysis. Apply the normalization filters discussed in the previous section to construct a "Should-Cost" model that reflects the true market reality. Step 4: Gap Identification. Quantify the exact delta between your current contractual pricing and the established market benchmarks. Step 5: Strategy Integration. Feed these findings directly into your RFP management and negotiation playbooks to secure maximum leverage during renewals.
Prioritizing Categories for Analysis
Utilize a rigorous Pareto analysis to identify the top 20% of suppliers that drive 80% of your total procurement costs. These high-impact categories must be benchmarked first to realize immediate margin expansion. High-volatility sectors, particularly those impacted by the 2026 energy price spikes, require monthly benchmarking cycles to stay ahead of supplier-driven price shocks. While "tail spend" represents lower individual transaction values, it often contains the highest percentage of unmanaged price creep. Implementing procurement category cost benchmarking and analytics allows you to automate the oversight of these secondary categories without diverting resources from strategic priorities.
Validating Findings with Stakeholders
Data without internal consensus is functionally useless for negotiation. You must present your benchmarking findings as a clinical diagnostic to gain C-suite buy-in, focusing on quantifiable cost savings and risk mitigation metrics like ISO 14001:2026 compliance. Cross-functional teams from finance, operations, and legal should verify the data accuracy to ensure the benchmarking model accounts for all operational realities. This collaborative validation facilitates a seamless transition from abstract data analysis to tactical negotiation execution. When stakeholders trust the data, procurement can act with the authority needed to challenge opaque supplier pricing models effectively.
Beyond the Benchmark: Leveraging Analytics for Negotiation and Risk Management
Benchmarking data is a dormant asset until it is deployed as a strategic lever in high-stakes negotiations. Mastering how to benchmark supplier pricing provides the empirical evidence required to dismantle supplier justifications for price hikes. In the current 2026 fiscal environment, where the World Bank forecasts a 16% rise in global commodity prices, relying on anecdotal market sentiment is a liability. You need a clinical diagnostic that converts raw data into a position of strength. This transition from observation to execution is where procurement departments generate tangible enterprise value.
Professional negotiation assistance utilizes these benchmarks to establish "Should-Cost" boundaries. When a supplier understands that your team possesses real-time intelligence on their internal margin structures and regional price variances, the power dynamic shifts. This data-driven approach eliminates the information gap, forcing vendors to align their proposals with the competitive reality of the 2026 market. It’s the difference between asking for a discount and demanding market alignment based on verified analytics.
Forecasting and Price Risk Management
Historical benchmarks serve as the foundation for sophisticated market price trending. By analyzing the 17.9% surge in U.S. energy costs seen in April 2026, organizations can build predictive models that forecast future cost shifts across the supply chain. These "Should-Cost" models are essential for long-term contract negotiations, allowing you to bake in price protection mechanisms before volatility strikes. Integrating an automated price risk management and tracking service ensures your procurement team isn't reacting to inflation but anticipating it. This proactive stance protects your margins from the 3.8% annual inflation rate currently impacting the U.S. economy.
Realizing Savings through Vendor Performance Tracking
Benchmarking is functionally useless if the negotiated savings aren't realized over the life of the contract. "Price creep" often occurs post-negotiation through unmonitored surcharges or subtle SKU substitutions. A robust procurement and vendor performance tracking service acts as the final safeguard in your fiscal architecture. It ensures that every invoice reflects the benchmarked rates secured during the RFP process. By maintaining this level of clinical oversight, you realize the quantifiable cost savings promised to the C-suite. Sustained margin expansion requires more than a winning bid; it demands a continuous loop of analysis, negotiation, and rigorous performance auditing.
To secure maximum leverage in your next renewal cycle, you must move beyond static reports. Optimize your procurement outcomes with RightCostIQs professional RFP and negotiation services to transform market volatility into a strategic asset.
Securing Strategic Leverage in an Era of Fiscal Volatility
Transforming procurement from a reactive cost center into a strategic engine for margin expansion requires a permanent shift toward clinical execution. You now understand that mastering how to benchmark supplier pricing involves more than collecting quotes; it demands rigorous data normalization and continuous performance tracking to eliminate fiscal leakage. By integrating real-time market intelligence with a structured benchmarking architecture, you effectively close the information gap that vendors use to maintain opaque margins.
The 2026 economic landscape, defined by energy price surges and shifting regulatory mandates, leaves no room for administrative guesswork. Realizing quantifiable cost savings depends on your ability to deploy "Should-Cost" models during high-stakes negotiations. RightCostIQ provides the technical infrastructure necessary to maintain this competitive advantage. We offer clinical precision in category cost benchmarking, expert-led negotiation assistance for high-value contracts, and real-time market price trending and forecasting models.
Request a Consultation for Advanced Procurement Benchmarking and RFP Management to begin your transition toward data-driven procurement optimization. You're ready to convert market volatility into a measurable enterprise asset.
Frequently Asked Questions
How often should we benchmark our primary supplier pricing?
High-volatility categories require quarterly or even monthly benchmarking to stay aligned with the 17.9% energy cost fluctuations seen in 2026. Stable categories can be monitored bi-annually. The objective is to prevent price creep between renewal cycles. Continuous monitoring ensures your negotiation leverage does not erode as market conditions shift. This rhythmic cadence allows procurement to act with strategic urgency rather than reacting to supplier-driven price shocks.
What is the difference between price benchmarking and cost benchmarking?
Price benchmarking focuses on the external market rate for a specific SKU or service, whereas cost benchmarking analyzes the internal components of a supplier’s pricing model. Cost benchmarking decomposes the bid into labor, materials, and overhead. This clinical approach identifies exactly where a vendor is padding their margins. Understanding how to benchmark supplier pricing through both lenses provides the maximum possible leverage during high-stakes RFP management.
Can we benchmark pricing for highly specialized or custom services?
Specialized services are benchmarked using a "Should-Cost" model based on proxy data and component-level analysis. You isolate standard variables like labor rates in specific geographies or specialized equipment costs. By normalizing these inputs, you create an objective baseline even for unique service level agreements. This prevents suppliers from using "specialization" as a tactical shield for opaque, non-competitive pricing structures that mask fiscal leakage.
How do we handle suppliers who refuse to share detailed pricing structures?
You bypass supplier opacity by utilizing third-party market intelligence and historical RFP results from similar categories. If a vendor refuses transparency, you must rely on external cost benchmarking and analytics to simulate their cost structure. Objective data from a price risk management service forces the supplier to defend their position against verified market trends. This technical diagnostic effectively eliminates the information gap regardless of supplier cooperation.
What are the best tools for automated procurement price benchmarking in 2026?
Leading organizations utilize AI-driven platforms that integrate real-time market indices with internal ERP data. In 2026, the best tools incorporate automated tracking for regulatory compliance, such as California’s SB 253 emissions reporting. These platforms must offer market price trending and forecasting service capabilities. This infrastructure allows for continuous benchmarking rather than static, annual reports that become obsolete within weeks of publication due to current market volatility.
How much can a typical enterprise save through a clinical benchmarking exercise?
Clinical benchmarking typically identifies a 10% to 20% delta between current contract rates and true market pricing. High-volatility categories like energy or logistics often reveal higher variances due to the 17.9% price spikes seen in early 2026. By applying a repeatable methodology, procurement teams secure quantifiable cost savings that directly impact EBITDA. These results are achieved through expert-led negotiation assistance backed by hard, normalized data points.
What is the role of AI in modern supplier price benchmarking?
AI functions as a high-speed analytical engine that automates data normalization and anomaly detection across thousands of line items. It identifies how to benchmark supplier pricing at scale by processing unstructured data from RFPs and market indices. Modern AI models also forecast price risk by correlating geopolitical events with commodity fluctuations. This allows procurement leaders to move from historical analysis to proactive, data-driven sourcing strategies that prioritize operational efficiency.