
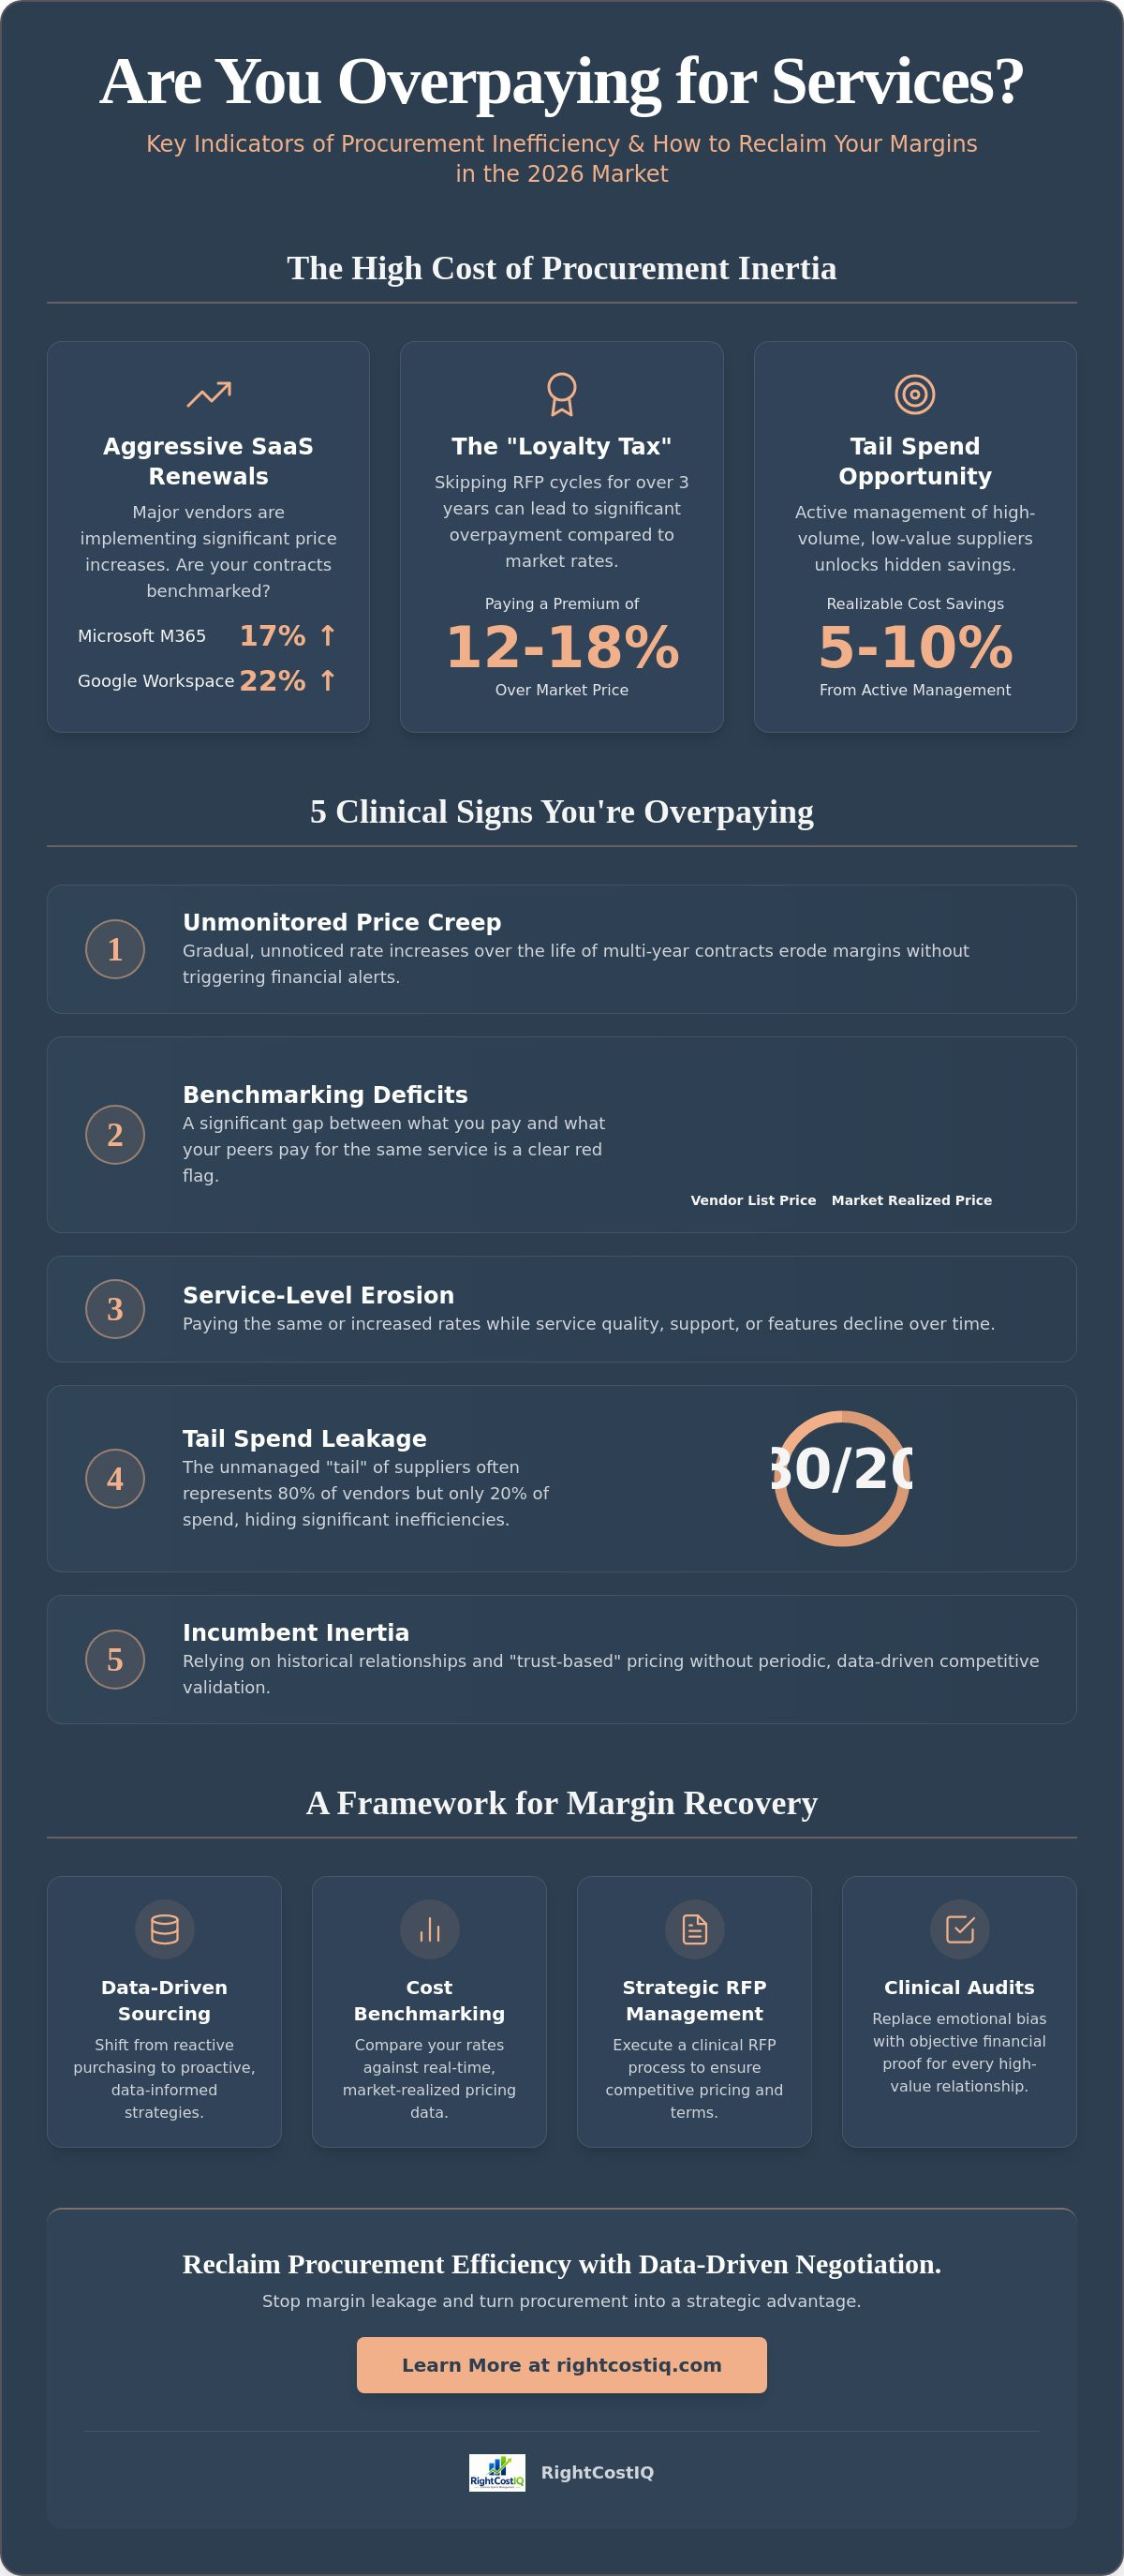
Organizations that actively manage tail spend often realize 5 to 10 percent cost savings, yet many leaders remain blind to the 80 percent of suppliers driving this hidden margin leakage. With Microsoft M365 business tiers rising up to 17 percent and Google Workspace increasing by 22 percent in early 2025, the cost of procurement inertia has never been higher. If your internal teams lack the real-time data to challenge these aggressive vendor renewals, you're likely ignoring the clinical signs you are overpaying for services. It's frustrating to watch incumbent vendors increase rates while service quality remains static, but without objective benchmarking, your negotiation leverage is nonexistent.
We recognize that the 2026 market demands a shift from reactive purchasing to data-driven sourcing. This article provides the framework you need to identify cost anomalies and reclaim procurement efficiency through strategic negotiation. We'll analyze seven specific indicators of overpayment and provide a roadmap for margin expansion. By the end of this guide, you'll have the objective proof required to optimize your high-value service contracts and eliminate the "junk fees" that erode your bottom line.
Key Takeaways
- Audit multi-year contracts for unmonitored price creep to protect organizational margins against 2026 market volatility.
- Implement category cost benchmarking to identify the delta between vendor list prices and actual market-realized pricing.
- Identify the clinical signs you are overpaying for services, specifically focusing on service-level erosion and the unbundling of core rate architectures.
- Address tail spend leakage by centralizing the management of high-volume, low-value service providers across the enterprise.
- Utilize a strategic RFP management framework to reclaim procurement efficiency through data-driven negotiation and clinical market discovery.
The 2026 Procurement Landscape: Why Relationship Pricing is a Liability
The year 2026 has fundamentally altered the procurement process, rendering legacy pricing models obsolete. In a B2B context, price creep manifests as a gradual, unmonitored escalation of service rates over the lifespan of multi-year contracts. This slow inflation often bypasses standard financial triggers because the individual increases appear negligible at the line-item level. However, when aggregated across an enterprise service portfolio, these increments represent a severe structural drain on net margins. Relying on handshake deals or historical benchmarks is no longer a sustainable strategy for high-level decision-makers who must prioritize operational efficiency.
Market volatility in 2026, driven by rapid AI integration and shifting labor dynamics, means that what was considered "fair pricing" in 2024 or 2025 is no longer a valid benchmark for current renewals. Renewing a contract based on historical rates rather than real-time market data is a strategic failure. Strategic sourcing now requires a clinical focus on data-driven intelligence to replace the subjective, trust-based procurement methods of the past. Relying on vendor trust without verification is one of the primary signs you are overpaying for services in a market where SaaS prices are climbing by an average of 8 to 12 percent annually, often without a corresponding increase in delivered value.
The Erosion of Static Contract Value
Technological disruption and aggressive vendor price restructuring have significantly compressed the lifespan of competitive pricing. Traditional fixed-price contracts, once viewed as a hedge against inflation, now act as anchors that prevent organizations from capturing downward price trends in automated service sectors. In 2026, market-responsive optimization is the only viable path to efficiency. Categories such as IT managed services, logistics, and professional consulting are currently experiencing high price variance. If your contracts don't include mechanisms for periodic market adjustments, you're likely subsidizing your vendor’s inefficiency while they benefit from their own internal automation gains.
When auditing your professional service agreements, you can check out Pioneer HR for strategic consultancy that provides practical advice for employers looking to optimize their HR functions.
Incumbent Inertia: The Hidden Cost of Loyalty
Maintaining long-term vendor relationships without periodic competitive testing creates a financial penalty known as the loyalty tax. Enterprises that skip a formal RFP cycle for more than three years often pay a premium of 12 to 18 percent over current market-realized pricing. This "Incumbent Inertia" is often fueled by psychological barriers, such as the fear of transition friction or perceived relational debt. Overcoming these hurdles requires a Clinical Audit of every high-value relationship. By utilizing should-cost modeling and rigorous RFP management, procurement teams can replace emotional bias with objective financial proof. Challenging a partner isn't a sign of distrust; it's a fundamental requirement for maintaining a healthy, high-performance supply chain that prioritizes the bottom line over institutional comfort.
Benchmarking Deficits: Identifying Price Variance via Analytics
Category Cost Benchmarking is the primary mechanism for identifying margin leakage within a service portfolio. It moves beyond simple price comparisons to analyze the competitive landscape of specific service categories with clinical precision. High-level decision-makers often rely on "List Price," which is the vendor's advertised rate. However, the "Market Realized Price", which represents the actual price paid by peers for similar service levels, is the only metric that matters. Identifying a significant delta between these two values is one of the clearest signs you are overpaying for services. Without this data, your procurement team is negotiating in a vacuum, essentially accepting the vendor's internal margin targets as market reality.
Analytics platforms allow for the identification of spend outliers across disparate departments. When one division pays 15 percent more for the same IT managed service than another, it signals a lack of centralized oversight and strategic alignment. This variance often hides deeper issues, including common procurement fraud schemes such as bid-rigging or inflated invoices. Clinical precision in spend analysis exposes these irregularities before they become institutionalized. If your current infrastructure doesn't flag these variances automatically, you're likely missing significant recovery opportunities.
Leveraging Should-Cost Models for Service Sourcing
Effective negotiation requires a granular breakdown of the vendor’s cost structure, including labor rates, administrative overhead, and net margin. A should-cost analysis is a bottom-up calculation of what a service should cost based on market inputs. By presenting a vendor with a data-backed model of their own operational costs, procurement teams shift the power dynamic. You're no longer debating a quote; you're auditing a business model. This level of transparency forces vendors to justify their margins against objective market realities rather than subjective value claims.
Real-Time Benchmarking vs. Historical Data
Relying on data from 2024 or 2025 in the 2026 market is a strategic liability. Service categories like cloud computing and AI-driven customer support are experiencing rapid deflation in operational costs while list prices remain high. Integrating market price trending into your procurement infrastructure ensures that renewals reflect today's value, not yesterday's norms. We recommend a quarterly benchmarking cadence for high-volatility categories to capture these shifts effectively. To identify immediate recovery opportunities in your portfolio, you can run a preliminary spend diagnostic to pinpoint specific areas of overpayment.
Service-Level Erosion and the "Hidden Fee" Architecture
The 2026 procurement landscape is plagued by a phenomenon where organizations pay contemporary rates for legacy execution. It's a critical sign you are overpaying for services when your invoice reflects 2026 inflation adjustments while the vendor’s technological stack and delivery methodology remain stagnant since 2022. This discrepancy indicates that you are funding the vendor's margin expansion rather than investing in your own operational growth. Sophisticated vendors utilize a "Hidden Fee" architecture to mask these increases, unbundling core services into separate, billed line items under the guise of "infrastructure" or "administrative" surcharges. Without a clinical approach to contract auditing, these fees become institutionalized, eroding your budget without providing any incremental value.
Strategic decision-makers must recognize that "Service Credit" systems are inherently flawed. These credits often fail to compensate for the actual operational downtime or the cascading financial impact of missed deliverables. Instead of accepting passive credits, you must implement a robust Vendor Performance Tracking Service to ensure absolute contract compliance. This data-driven oversight transforms the relationship from one of blind trust to one of objective accountability, where payments are strictly tied to verified performance metrics. If your vendors are not meeting their commitments, they should not be capturing their full margin.
Detecting Scope Creep and Unbundled Costs
Administrative surcharges, technology access fees, and "cost-to-serve" adjustments often signal a vendor's attempt to artificially inflate margins. A thorough audit against the original Master Service Agreement (MSA) is essential to identify these unauthorized costs. You should look for services that were previously included in the core rate but are now billed separately. For a deeper dive into structural optimization, review our framework on Category Management in Procurement: A Clinical Framework for Margin Expansion (2026). This strategic alignment ensures that your category spend remains optimized even as market conditions shift.
Quantifying Service-Level Agreement (SLA) Underperformance
Calculating the financial impact of missed KPIs requires more than a cursory review of monthly reports. You must quantify the direct and indirect costs associated with service failures, from lost employee productivity to delayed project timelines. We recommend tying vendor payments directly to verified performance data through automated compliance tracking architectures. This clinical lever forces vendors to prioritize your outcomes. When a vendor realizes that their revenue is contingent upon meeting specific, data-backed benchmarks, the quality of service delivery improves. Automated tracking eliminates the manual labor of auditing, providing a relentless focus on bottom-line efficiency.
Tail Spend Leakage: The Invisible Drain on Enterprise Margins
Tail spend represents the high-volume, low-value transactions that typically escape C-suite scrutiny, yet it accounts for approximately 20 percent of an organization's total expenditure. While procurement teams focus on high-value strategic contracts, this unmanaged "tail" often contains the highest percentage of overpayment within the enterprise. One of the most definitive signs you are overpaying for services is the discovery of multiple vendors providing identical services at disparate price points across different departments. This lack of visibility into the bottom 80 percent of the supplier base creates a structural drain on margins that compounds over time. If you're not auditing these smaller contracts, you're essentially allowing a thousand small leaks to sink your financial ship.
Organizations that actively manage this segment can realize 5 to 10 percent cost savings on that spend. In 2025, data showed that tail spend varied significantly by industry, ranging from 8.9 percent in Technology to 26.5 percent in the Public Sector. Regardless of the industry, decentralized purchasing leads to Maverick Spend, where individual managers bypass established procurement protocols. This behavior results in lost volume discounts and a fragmented service landscape that is impossible to audit manually. If your data doesn't flag these redundant vendors, it's one of the primary signs you are overpaying for services in a decentralized environment. Implementing a clinical Tail Spend Management strategy is essential for reclaiming these lost margins and improving overall procurement ROI.
The Fragmentation of Service Procurement
Maverick spend occurs when departments act as independent procurement entities, selecting vendors based on personal preference or historical habit rather than enterprise-wide value. This fragmentation prevents the organization from leveraging its total volume to secure competitive rates. You're losing leverage every time a department head signs a localized service agreement. To correct this, you must consolidate fragmented services into a single, high-leverage category managed by a centralized framework. This transition eliminates price variance and ensures that every dollar spent aligns with the organization's broader financial objectives.
Automating Tail Spend Optimization
The sheer volume of transactions within the tail makes manual oversight impossible. AI-led platforms are now the clinical standard for identifying consolidation opportunities that human auditors overlook. These tools categorize spend in real-time, highlighting redundant vendors and price anomalies instantly. Migrating tail spend into managed category frameworks allows for immediate margin expansion without disrupting operational workflows. By automating the identification of these inefficiencies, procurement leaders can shift their focus back to high-level strategy while the technology secures the bottom line. To uncover the specific leakage points in your unmanaged spend, perform a comprehensive spend diagnostic to identify immediate recovery targets.
Strategic Re-Negotiation: Executing the RFP for Margin Recovery
Executing a Request for Proposal (RFP) is not an act of hostility; it's a clinical market discovery exercise. When you identify the structural signs you are overpaying for services, the RFP serves as the primary diagnostic instrument to reset your cost basis. Handshake deals and "loyalty-based" renewals are liabilities that prioritize vendor profit over enterprise efficiency. A professional RFP Management Cycle follows a rigorous 5-step framework: internal needs assessment, market discovery benchmarking, RFP issuance with cost-unbundling requirements, shortlist analysis, and performance-integrated contract finalization. This methodical approach ensures that every service agreement is optimized for the 2026 economic landscape.
Neutralizing vendor sales tactics requires a shift from emotional negotiation to data-driven auditing. Sophisticated vendors often use "partnership" rhetoric to deflect from uncompetitive rates. Utilizing professional Negotiation Coaching allows procurement teams to dismantle these narratives with clinical precision. By integrating market price trending and forecasting into your final contract terms, you mitigate future price risk and ensure that your organization captures the benefits of technological deflation. Contracts must be dynamic, not static, to maintain a competitive edge in a volatile market.
The RFP as a Market Intelligence Tool
Structure your RFP to extract maximum transparency by requiring bidders to provide a granular breakdown of labor, technology, and overhead costs. This unbundling prevents vendors from hiding excessive margins within opaque service packages. You should include specific "Should-Cost" targets within the documentation to signal that your organization is informed by real-time market analytics. For a technical analysis of these processes, review our framework on RFP Management: Strategic Frameworks for AI-Led Procurement Optimization. This ensures your sourcing strategy remains aligned with modern procurement standards.
Clinical Negotiation: Data Over Emotion
Professional procurement requires the removal of subjective bias from the negotiation table. Managers must be equipped with scripts that challenge incumbent price increases through objective evidence. Consider these three specific frameworks:
- "Our benchmarking data indicates a 12 percent variance between your proposed rate and the current market-realized price for this service category. Please provide a justification for this delta."
- "We've identified service-level erosion over the last 24 months. We require a rate adjustment that reflects the actual quality of delivery rather than historical norms."
- "This renewal is contingent upon the inclusion of a market-responsive adjustment clause to protect our margins against 2026 volatility."
Always define your Best Alternative to a Negotiated Agreement (BATNA) before entering discussions. This transition from "Vendor Management" to "Strategic Partnership Optimization" ensures that your suppliers are working for your margins, not against them. Data is the only lever that matters in a high-stakes negotiation.
Reclaiming Your Competitive Margin through Data-Driven Sourcing
The 2026 procurement environment leaves no room for relational inertia or unverified cost structures. Identifying the clinical signs you are overpaying for services is the first step toward structural margin recovery. We've established that reliance on historical pricing is a liability and that unmanaged tail spend acts as an invisible drain on enterprise profitability. By transitioning to a clinical model of Category Cost Benchmarking and Analytics, you replace subjective trust with objective financial proof. This transformation ensures that every vendor relationship is optimized for maximum efficiency and performance.
Strategic success now depends on your ability to integrate real-time Market Price Trending into your negotiation frameworks. Our proprietary Negotiation Coaching for enterprise sourcing empowers your team to neutralize vendor tactics with data-driven confidence. Don't allow unmonitored price creep to erode your bottom line. You can optimize your procurement outcomes with RightCostIQ’s RFP Management and Negotiation Assistance today. It's time to leverage professional Price Risk Management to secure your organization's financial future and drive sustainable growth.
Frequently Asked Questions
What are the most common signs of overpaying for IT services in 2026?
Organizations typically overpay for IT services when they accept unbundled "AI surcharges" or "infrastructure fees" that lack documented performance improvements. If your vendor increases rates annually by more than 10 percent while maintaining 2022-era service delivery, you're funding their margin expansion. Clinical oversight requires flagging any cost escalation that isn't directly tied to a verifiable upgrade in hardware capability or software automation.
How often should a company conduct a full RFP for recurring professional services?
Executing a full RFP every three years is the clinical standard for capturing market-responsive pricing and technological advancements. Maintaining a vendor relationship beyond this three-year window without competitive testing often results in a loyalty tax of 12 to 18 percent. Periodic market discovery ensures that your enterprise cost basis remains strictly aligned with current realized pricing rather than historical norms.
Can Should-Cost analysis be applied to intangible services like consulting or legal?
Should-cost analysis is highly effective for professional services when you deconstruct the engagement into billable hours, seniority mix, and administrative overhead. This bottom-up calculation identifies the vendor's net margin and highlights structural inefficiencies in their delivery model. It acts as a powerful lever for challenging opaque "value-based" pricing models that frequently mask significant overpayment.
What is the difference between spend analysis and cost benchmarking?
Spend analysis is an internal audit focused on capital allocation patterns, whereas cost benchmarking is an external comparison against market-realized pricing. Spend analysis identifies where your money goes; benchmarking identifies what that money should actually buy. Integrating both disciplines provides the objective proof required to detect signs you are overpaying for services across fragmented global departments.
How do I identify "Maverick Spend" in a decentralized global organization?
Identifying maverick spend requires the centralization of transaction data to highlight department-level purchases that bypass established procurement protocols. Discrepancies in unit pricing for identical services across different regions serve as definitive indicators of decentralized leakage. Automated spend categorization tools flag these outliers instantly, allowing procurement leaders to consolidate categories and recover lost volume discounts.
Is it possible to overpay for a service even if the vendor meets all SLAs?
It's common for organizations to overpay for services that meet all Service Level Agreements if those SLAs are based on outdated performance metrics. If a vendor meets 2022-era targets at 2026 market rates, you're subsidizing their internal efficiency gains. Contract compliance does not guarantee market-competitive pricing; it only confirms that the vendor is meeting the minimum legal requirements of a potentially obsolete agreement.
What role does market price trending play in multi-year contract negotiations?
Market price trending serves as a critical forecasting tool to mitigate future price risk by identifying deflationary or inflationary cycles before they manifest in invoices. Integrating these trends into contract terms allows for dynamic rate adjustments rather than static, fixed-price anchors. This strategic foresight protects enterprise margins against the inherent volatility of the 2026 procurement landscape.
How can a negotiation coach help reduce service procurement costs?
A negotiation coach provides the technical frameworks necessary to neutralize vendor sales tactics and emotional leverage during high-stakes renewals. They assist procurement teams in defining a clinical BATNA and utilizing should-cost models as primary negotiation levers. This professional assistance ensures that signs you are overpaying for services are addressed with assertive, evidence-based challenges that prioritize the bottom line.


