
Does your procurement strategy rely on objective financial intelligence or the dangerous subjectivity of "good enough" supplier relationships? High-level decision-makers recognize that subjective evaluations lead to operational friction and an inability to link vendor performance to bottom-line growth. Without a clinical, data-driven approach, your supply chain remains vulnerable to hidden risks and margin erosion. Implementing a standardized vendor performance scorecard template transforms these data silos into a strategic architect’s most powerful tool for negotiation and risk mitigation.
You've likely experienced the frustration of data silos that prevent a holistic view of supplier risk. We'll show you how to master the architectural framework of high-performance vendor scoring to drive margin expansion and supply chain resilience. This article outlines a repeatable scorecard framework that provides the objective data you need to leverage during contract negotiations. You'll learn to align technical execution with high-level financial strategy, ensuring your procurement function operates as a primary driver for corporate growth.
Key Takeaways
- Replace qualitative assessments with objective, quantifiable data engines to ensure procurement optimization and operational efficiency.
- Utilize a standardized vendor performance scorecard template to track high-impact metrics like cost variance, lead times, and total cost of ownership.
- Master the weighted scoring model to align supplier performance directly with business criticality and bottom-line financial impact.
- Implement systematic data collection protocols that transform fragmented information silos into actionable insights for high-stakes contract negotiations.
- Evolve from static manual tracking to automated performance analytics to achieve real-time visibility across complex global supply chains.
The Strategic Architecture of a Modern Vendor Performance Scorecard
A modern vendor performance scorecard template functions as a high-precision instrument for margin protection. It doesn't just track delivery dates; it quantifies the intersection of supplier reliability and financial growth. Traditional sourcing models often rely on qualitative assessments that fail to capture the true financial impact of supplier behavior. In the volatile market of 2026, where the global vendor management systems market is projected to reach $11.51 billion, relying on legacy spreadsheets creates unacceptable price risk. Strategic architects must pivot toward clinical, data-driven performance metrics that align directly with organizational margin expansion goals. This shift mirrors the evolution of the Balanced Scorecard, which pioneered the integration of non-financial indicators into high-level corporate strategy.
Static templates fail to account for the rapid shifts in the current procurement environment. For example, the June 2026 implementation of GSA MAS "Pricing 2.0" algorithms and mandatory Transactional Data Reporting (TDR) has fundamentally changed how market baselines are calculated. These regulatory shifts require a framework that converts raw data into clinical market intelligence. By aligning vendor KPIs with bottom-line objectives, procurement teams move from reactive administrative tasks to proactive financial engineering. Spreadsheets create price risk. Objective data builds resilience.
Beyond Compliance: The Value Proposition
Transforming raw vendor data into actionable negotiation levers is the primary function of a sophisticated tracking system. Precision tracking identifies hidden costs like inventory carrying fees caused by lead-time variability or quality-related rework expenses. Standardized benchmarks reduce operational friction by establishing objective performance floors. This transparency allows procurement leaders to enter contract renewals with a data-backed mandate for cost reduction. It's about moving from anecdotal evidence to a position of unassailable leverage during high-stakes negotiations.
The Anatomy of a High-Performance Framework
Constructing a high-performance vendor performance scorecard template requires a clear distinction between operational KPIs and strategic value metrics. Operational excellence focuses on fulfillment rates and defect ratios, while strategic metrics track price stability and innovation contribution. Automated data capture is critical for maintaining scorecard integrity. Manual entry is prone to bias. It creates latency that compromises the reliability of the analysis. High-performance frameworks ensure cross-departmental alignment by defining success criteria that reflect both supply chain resilience and financial health. This holistic view prevents the common pitfall of optimizing for single metrics while ignoring the total cost of ownership.
Essential Metrics for Clinical Procurement Precision
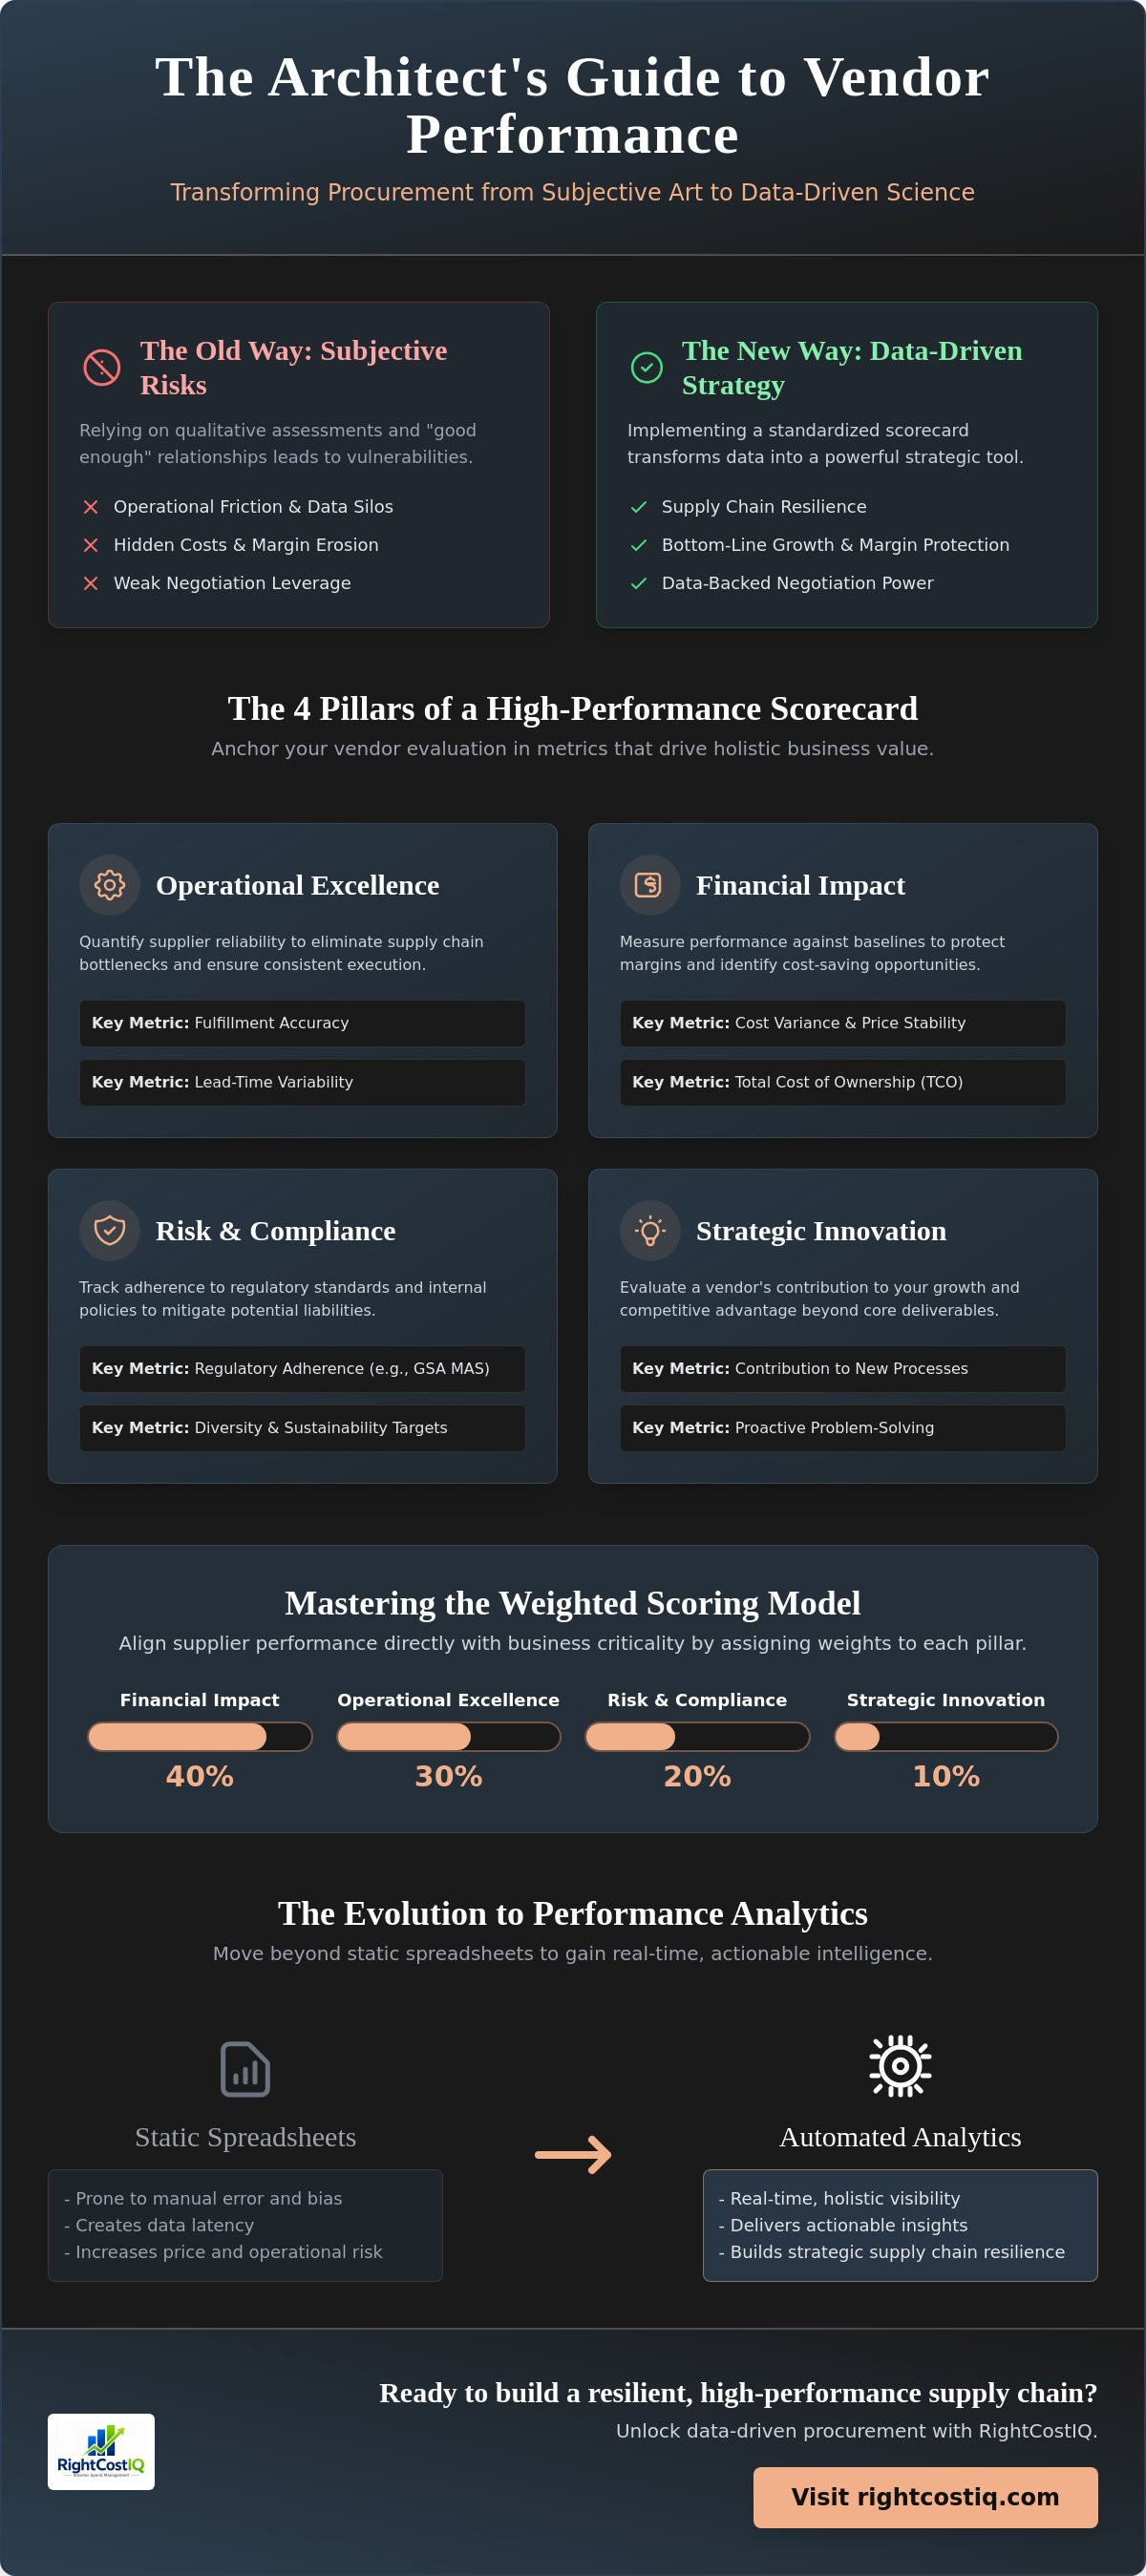
Precision in procurement demands a rigorous selection of KPIs that transcend surface-level reporting. A high-utility vendor performance scorecard template must anchor itself in four clinical pillars: operational excellence, financial impact, risk mitigation, and strategic innovation. While operational metrics like lead times and fulfillment rates provide the baseline for supplier reliability, high-level decision-makers require deeper visibility into financial stability to protect organizational margins. With the global vendor management systems market projected to reach $11.51 billion in 2026, the cost of data inaccuracy is higher than ever. To effectively measure supplier performance, your framework must capture the total cost of ownership (TCO) rather than isolated unit prices. This holistic perspective ensures that procurement decisions drive bottom-line results rather than superficial savings.
- Operational Excellence: Quantifying fulfillment accuracy and lead-time variability to eliminate supply chain bottlenecks.
- Financial Impact: Measuring cost variance and price stability against contractual baselines to ensure margin protection.
- Risk and Compliance: Tracking adherence to regulatory standards, including the June 2026 GSA MAS AI provisions and diversity targets.
- Innovation: Evaluating a vendor's ability to provide proactive cost-saving suggestions and adopt emerging technologies.
Quantifying Financial Performance
Tracking actual spend against procurement category cost benchmarking standards reveals the true efficiency of your supplier partnerships. Organizations often overlook "cost-to-serve" metrics, which include the administrative and quality-control overhead required to manage a specific vendor. By measuring these hidden variables, you identify partnerships that erode margins despite competitive initial pricing. Evaluating vendor-driven savings through process optimization ensures that your suppliers contribute to long-term financial growth rather than merely fulfilling orders.
Risk Mitigation and Supply Chain Resilience
Incorporating market price trending into vendor evaluations is essential for managing price risk in a volatile economy. The 2026 shift toward mandatory Transactional Data Reporting (TDR) for GSA MAS contracts underscores the need for real-time visibility into market baselines. Monitoring a vendor's financial health prevents catastrophic supply chain disruptions. Your vendor performance scorecard template should also assess compliance with industry-specific standards and the new GSA MAS AI provisions. If your current process lacks these predictive elements, it's time to conduct a performance tracking audit for greater precision.
The Weighted Scoring Model: Linking Performance to Profit
Equal weighting is a strategic failure in procurement analytics. Treating a minor administrative delay with the same gravity as a critical quality breach or a price variance leads to skewed data and poor decision-making. A clinical vendor performance scorecard template requires a weighted architecture that mirrors your specific operational risks and margin expansion goals. By assigning numerical values to KPI importance, you transform a basic checklist into a high-precision financial instrument. This weighted approach ensures that your primary resources focus on the variables that most directly impact the bottom line. It's the difference between a generic administrative exercise and a sophisticated tool for supply chain optimization.
The output of this model is the Weighted Performance Index (WPI). This single, quantifiable metric provides C-suite executives with an immediate snapshot of supplier health. In a market where analytics and reporting modules account for 68.6% of the vendor management systems market share in 2026, the ability to distill complex data into a clear performance score is a competitive necessity. High-level decision-makers don't need raw data; they need actionable intelligence that links vendor behavior to corporate profitability.
Designing Your Weighting Framework
Effective weighting begins with identifying "Deal-Breaker" KPIs versus "Nice-to-Have" indicators. For Tier 1 suppliers, operational resilience and regulatory compliance might carry a 40% weight, while innovation metrics hold 10%. Conversely, for tail spend vendors, unit cost and delivery speed often take priority. The mathematical formula is direct: multiply the raw performance score by the assigned weight factor to reach a normalized value. This structure prevents high performance in low-impact areas from masking critical failures in essential service categories. It forces a relentless focus on the metrics that drive margin protection.
Normalizing Data Across Global Supply Chains
Standardizing scores across diverse geographic regions is essential for global supply chain transparency. With North America holding 27.90% of the VMS market in 2026, organizations must ensure that data from fragmented international product lines is comparable. Removing bias from subjective reviews requires multi-stakeholder input and established data collection protocols. You can't rely on a single manager's perception. Instead, aggregate data from procurement, finance, and operations to ensure statistical significance. This normalization process ensures that a "90%" score in one region represents the same level of excellence as a "90%" in another, providing a truly holistic view of supplier risk.
Step-by-Step: Implementing the Vendor Scorecard Template
Implementation requires a methodical transition from theory to operational execution. Start by defining objectives and selecting category-specific performance pillars that align with your organizational goals. A generic approach fails because a Tier 1 logistics provider and a tail-spend office supplier impact the bottom line in fundamentally different ways. Spreadsheets create latency. Establish data collection protocols and automated reporting cadences to ensure your vendor performance scorecard template remains a dynamic asset rather than a static document. This methodical setup ensures that every stakeholder understands the specific metrics that drive success.
Set performance thresholds and "critical fail" triggers to automate risk detection. These thresholds act as an early warning system for supply chain disruption, allowing you to intervene before a minor delay becomes a financial liability. Quarterly business reviews (QBRs) should be strictly powered by scorecard data to eliminate subjective bias and personal friction. This objective reporting allows procurement teams to integrate results into a negotiation assistance workflow. It transforms the renewal process into a data-backed exercise in margin expansion and strategic leverage.
Data Collection and Source Integrity
Automating data extraction from ERP and procurement platforms is essential to maintain source integrity. Manual data entry introduces latency and human error, which can compromise the clinical precision of your reports. Validate vendor-reported data against internal performance logs to identify discrepancies early. Establishing a "Single Source of Truth" for vendor metrics ensures that every department, from finance to operations, operates from the same financial intelligence. Without this level of data integrity, your scoring model loses its strategic authority and its ability to influence high-level decision-making.
The Feedback Loop: Driving Vendor Improvement
Communicating scorecard results to vendors with clinical precision fosters a culture of accountability and excellence. Don't just report failures; collaborate on Corrective Action Plans (CAPs) for underperforming suppliers to drive operational recovery. This structured feedback loop drives continuous improvement and reduces operational friction across your entire network. High-performing vendors should be rewarded with increased volume or preferred status to incentivize long-term excellence. This strategic alignment ensures your supply chain remains resilient, cost-efficient, and capable of supporting aggressive growth. To evaluate your current framework's effectiveness, access our performance tracking diagnostic.
Transitioning from Static Templates to Performance Analytics
Manual tracking in Excel creates unacceptable latency in high-complexity procurement environments. While a basic vendor performance scorecard template provides a necessary starting point, static spreadsheets cannot account for real-time market volatility or complex price risk. Strategic architects must pivot toward integrated performance analytics to maintain a competitive advantage. Leveraging RightCostIQ performance tracking services provides the real-time visibility necessary to identify margin erosion as it occurs. This transition converts fragmented data into a predictive engine, allowing procurement leaders to drive high-stakes contract negotiations with unassailable financial intelligence. By moving beyond manual entry, you eliminate the data silos that prevent a holistic view of supplier risk.
Integrating scorecard data with active RFP management ensures that future sourcing decisions are rooted in clinical performance history. Organizations often repeat sourcing errors by selecting low-cost vendors who generate high "cost-to-serve" overhead. Clinical performance analytics reveal these hidden costs, providing the leverage required to demand better terms or exit failing partnerships. This holistic approach aligns technical execution with high-level financial strategy, ensuring every contract renewal contributes to organizational resilience and bottom-line growth.
Scaling Performance Tracking for Enterprise Efficiency
Moving from annual reviews to continuous performance monitoring eliminates the information gaps that lead to supply chain disruption. Automated vendor performance tracking systems deliver a significant ROI by identifying cost variances before they compound into major financial losses. These intelligent data architectures reduce administrative overhead by automating data capture and reporting cadences. Efficiency isn't just about speed; it's about the precision of your financial oversight. Continuous monitoring ensures that your procurement function operates with the clinical accuracy required for enterprise-level scale, transforming a reactive department into a proactive profit center.
Smarter Sourcing Through Historical Performance Data
Using past scorecard data to inform future RFP requirements creates a closed-loop sourcing ecosystem. This historical intelligence allows you to eliminate underperforming vendors long before contract renewals begin. Achieving superior outcomes in complex category management requires a deep understanding of supplier reliability across diverse geographic regions. By leveraging performance intelligence, procurement teams move beyond transactional roles and become strategic drivers of margin expansion. Smarter sourcing isn't a goal; it's the result of a data-driven performance culture that prioritizes objective results over subjective relationships.
Strategic Evolution: From Static Reporting to Financial Intelligence
Mastering the architectural framework of supplier management requires a clinical transition from subjective reviews to data-driven performance engines. You've seen how a weighted scoring model links operational behavior directly to bottom-line profit, ensuring that every vendor interaction serves your margin expansion goals. By moving beyond a basic vendor performance scorecard template and adopting real-time analytics, your procurement department evolves from an administrative function into a strategic pillar of financial growth. This shift secures your supply chain against volatility while providing the objective leverage needed for high-stakes negotiations.
RightCostIQ provides the sophisticated tools necessary to maintain this level of oversight. We are specialized in healthcare financial analytics, offering advanced market price trending models and clinical RFP management frameworks. These capabilities ensure your sourcing decisions are backed by unassailable intelligence rather than outdated market assumptions. It's time to replace manual latency with automated precision to drive superior business outcomes and operational efficiency.
Optimize your vendor performance tracking with RightCostIQ precision analytics.
Take the next step in securing your supply chain resilience and protecting your corporate margins today.
Frequently Asked Questions
What is the most important metric in a vendor scorecard?
Total Cost of Ownership (TCO) serves as the primary metric for evaluating supplier efficiency. It transcends simple unit pricing to capture the cumulative financial impact of lead-time variability, defect ratios, and administrative overhead. High-level decision-makers prioritize TCO because it links supplier performance directly to organizational margin expansion. Relying solely on purchase price creates a strategic blind spot that often results in hidden operational costs and eroded profitability.
How often should vendor performance scorecards be updated?
Update cadences must align with supplier criticality and market volatility. Tier 1 vendors require monthly or quarterly reviews to ensure supply chain resilience and proactive risk mitigation. Conversely, tail-spend suppliers may only require semi-annual or annual evaluations. In the current 2026 procurement environment, real-time data integration is preferred over periodic manual updates to maintain clinical precision in your performance reporting and financial oversight.
How do you handle a vendor that disputes their scorecard results?
Resolve disputes by referencing objective data logs and established performance benchmarks. A clinical dispute resolution protocol relies on verified data from ERP systems rather than subjective manager perceptions. Presenting a standardized vendor performance scorecard template populated with quantifiable metrics eliminates emotional friction during these discussions. This data-driven approach maintains professional authority and forces the supplier to address specific operational failures with a structured corrective action plan.
Can I use the same scorecard template for all vendors?
A universal vendor performance scorecard template is ineffective across diverse procurement categories. Strategic architects utilize modular frameworks that adjust metric weighting based on supplier criticality and business impact. For example, logistics providers require heavy weighting on delivery precision, while raw material suppliers focus on quality consistency and price stability. Customizing the template ensures that your evaluation remains relevant to the specific strategic value each vendor provides.
What is the difference between a vendor assessment and a vendor scorecard?
Vendor assessments are pre-contractual evaluations focused on a supplier's potential capabilities and financial stability. They function as a gatekeeping mechanism during the RFP phase. A vendor scorecard tracks actual post-contractual performance against established KPIs and contractual obligations. While assessments predict future reliability, scorecards provide the historical financial intelligence required to optimize existing partnerships and drive long-term margin protection through continuous monitoring.
How does vendor performance tracking impact contract negotiations?
Performance tracking provides unassailable leverage during high-stakes contract renewals. It shifts the negotiation from anecdotal requests to data-backed mandates for cost reduction or service improvement. When you quantify a vendor's lead-time failures or cost variances, you possess the objective evidence needed to demand favorable terms. This clinical approach transforms the procurement function into a primary driver for corporate growth by securing superior contractual outcomes.
What are the red flags to look for in a vendor scorecard?
Critical red flags include increasing lead-time variability, consistent cost variance spikes, and declining fulfillment ratios. These indicators often signal underlying financial instability or operational decay within the vendor's organization. Strategic architects also monitor for compliance failures related to new 2026 GSA MAS AI provisions. Detecting these triggers early allows procurement leaders to intervene or initiate a transition to a more reliable supplier before a catastrophic disruption occurs.
How can I automate the data collection process for my scorecards?
Automation requires direct integration between your ERP architecture and a dedicated performance tracking service. This eliminates manual latency and ensures a single source of truth for all supplier metrics. Automated data capture maintains scorecard integrity by removing human bias and entry errors. By utilizing intelligent data architectures, you reduce administrative overhead and achieve the real-time visibility necessary for effective price risk management and global supply chain transparency.