

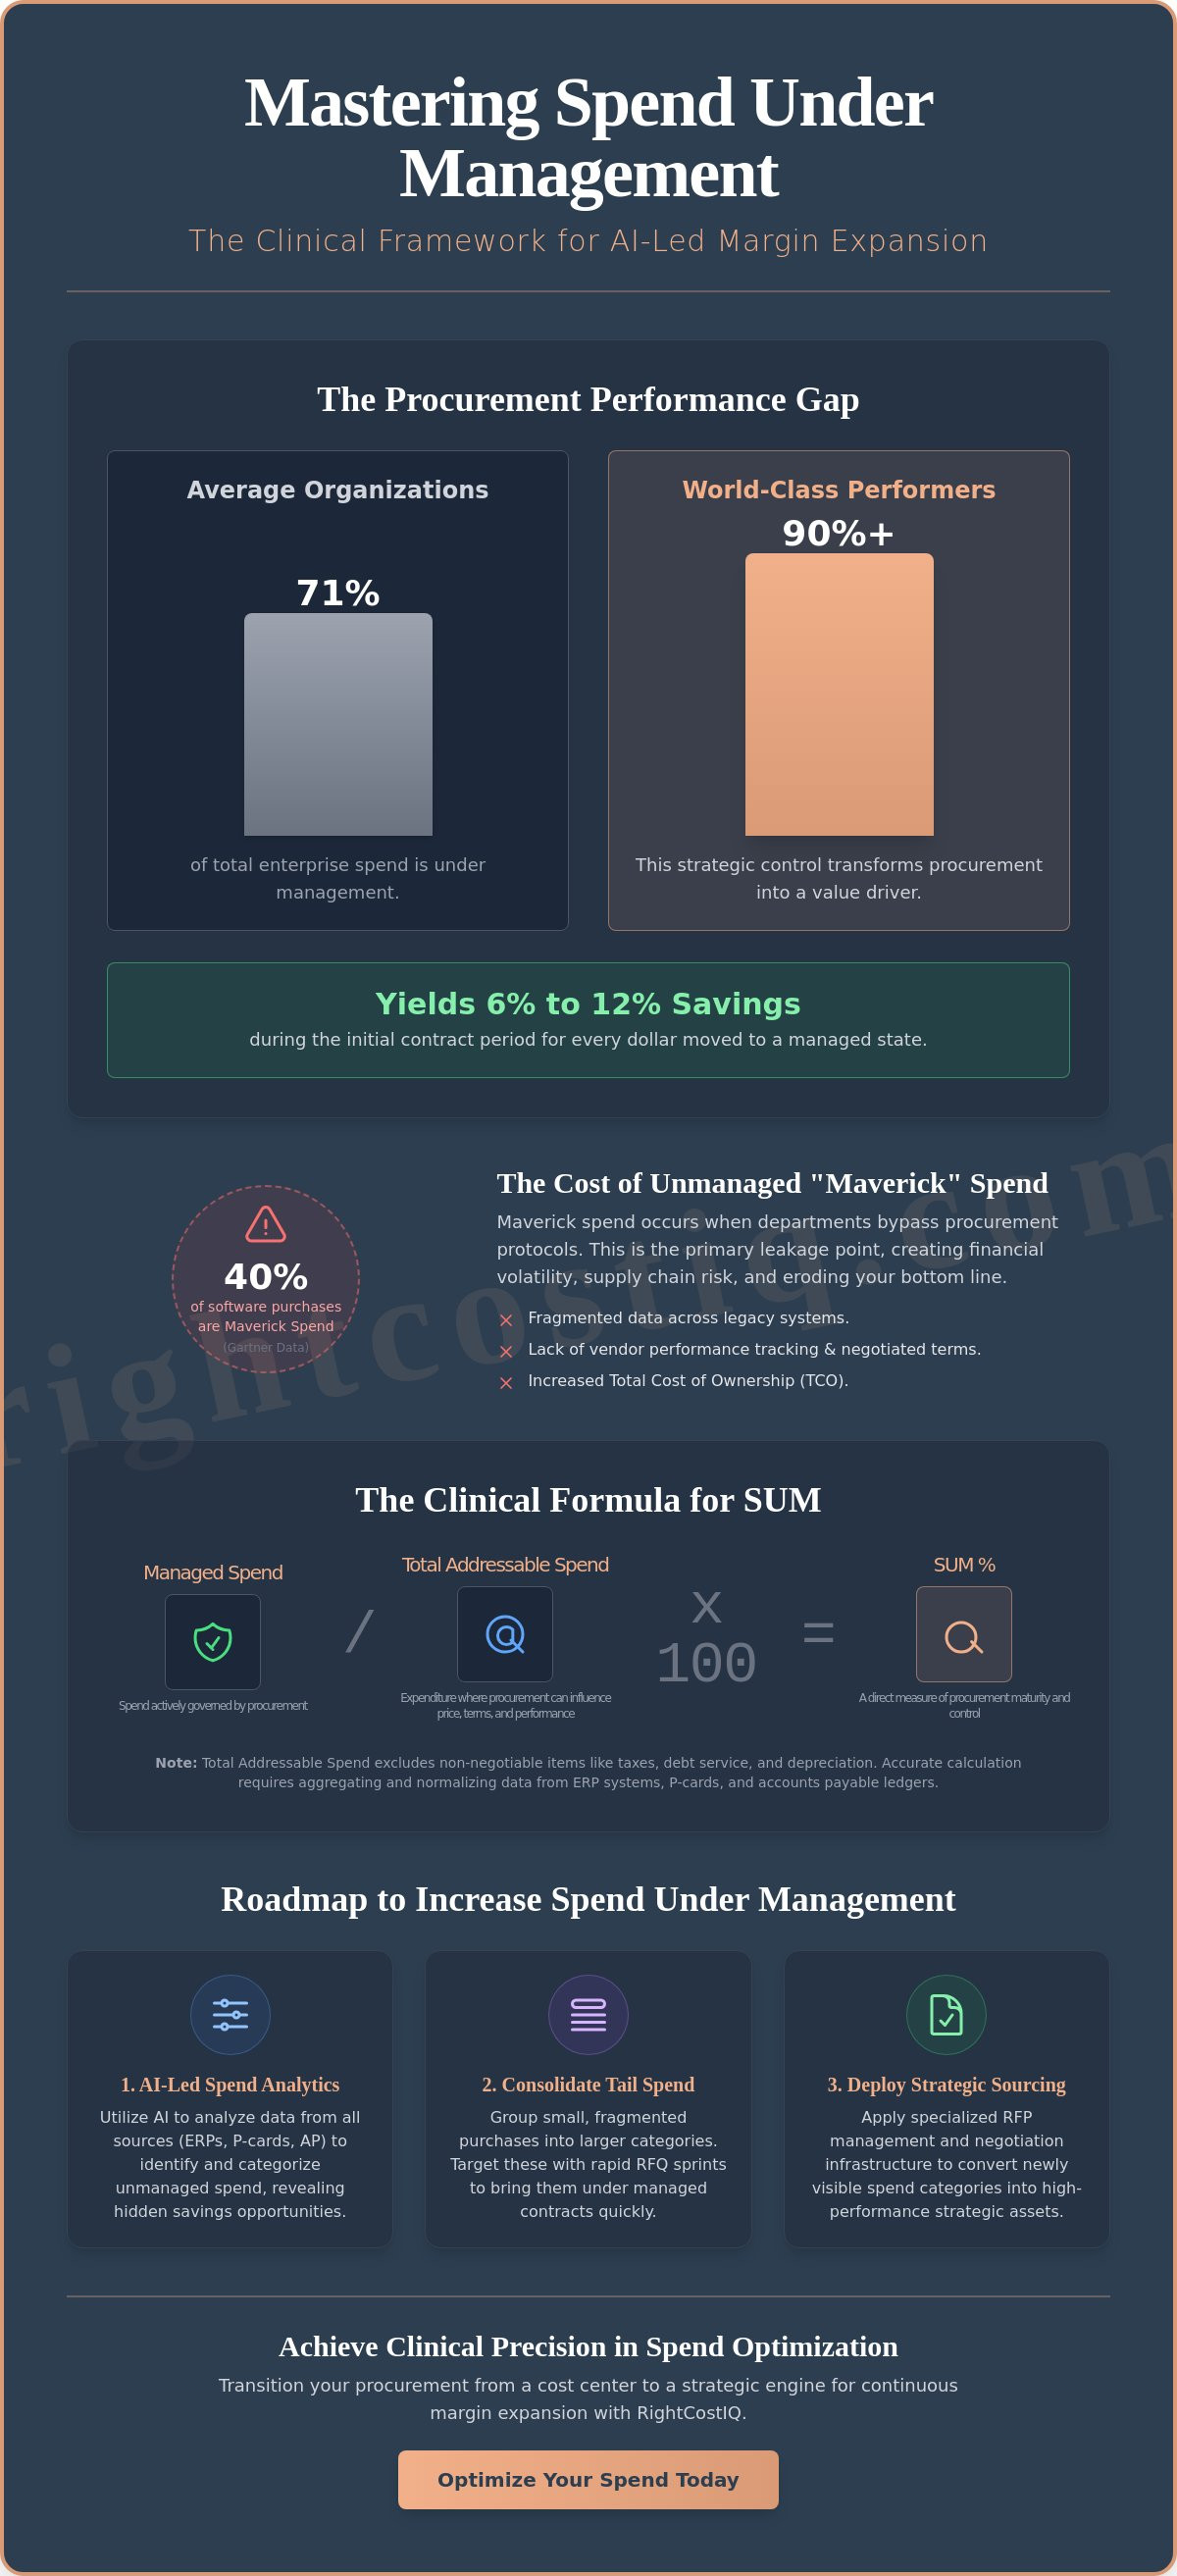
While the average organization maintains 71% of its total enterprise spend under the management of the procurement team, world-class performers capture over 90%, transforming procurement into a clinical engine for margin expansion. You've likely seen how fragmented data across legacy ERPs and the 40% of software purchases occurring as maverick spend, according to Gartner, erode your bottom line. It's a common struggle to gain visibility into tail spend while attempting to maintain strategic control over your procurement tech stack.
This framework provides the architectural roadmap to shift unmanaged spend to a managed state, utilizing a standardized formula for spend under management to drive 6% to 12% savings during initial contract periods. Procurement is the new value driver, and mastering this metric is the first step toward AI-led financial optimization. We'll detail the clinical calculation for SUM, outline a roadmap for spend intelligence, and demonstrate how to leverage category cost benchmarking to secure a permanent competitive advantage. By the end of this guide, you'll have the tools to move from fragmented data to a sophisticated, managed state that prioritizes margin expansion and procurement efficiency.
Key Takeaways
- Establish the clinical distinction between total organizational expenditure and addressable spend to define the precise scope of your procurement influence.
- Quantify procurement ROI by applying the core spend under management formula to data extracted from ERP systems, P-cards, and accounts payable ledgers.
- Avoid the operational trap of the 100% myth by identifying where the administrative burden of managing tail spend outweighs potential margin gains.
- Utilize AI-led spend analytics and rapid RFQ sprints to transition unmanaged categories into high-performance strategic assets for the enterprise.
- Deploy specialized RFP management and negotiation infrastructure to convert fragmented data into a standardized engine for continuous margin expansion.
What is Spend Under Management? Defining the Strategic Value Driver
Spend under management (SUM) is the clinical metric representing the percentage of an organization's total addressable spend actively governed by the procurement function. It's the primary architectural lever for AI-led margin expansion. High-level decision-makers often conflate total organizational expenditure with addressable spend. Total expenditure includes non-negotiable items like taxes, debt service, and depreciation. Addressable spend targets categories where procurement can apply a Strategic Sourcing Framework to influence pricing, terms, and vendor performance. High SUM percentages indicate that a business has achieved deep visibility and control over its cost structures. This visibility is the foundation for all subsequent optimization efforts.
Procurement is the new value driver because it moves beyond transactional processing to strategic financial management. When spend remains unmanaged, it exists in a state of entropy. Data is fragmented across legacy ERPs, and pricing remains subject to market volatility without the protection of indexed contracts. Increasing spend under management ensures that every dollar leaving the enterprise is scrutinized, benchmarked, and optimized. It transforms procurement from a back-office function into a sophisticated engine for bottom-line growth. Without a high SUM percentage, even the most advanced AI-led analytics will fail to deliver enterprise-wide results due to the lack of a controlled data environment.
Managed vs. Unmanaged Spend: The Cost of Maverick Purchasing
Maverick spend is the primary leakage point in modern procurement architecture. It occurs when departments bypass formal protocols to purchase goods or services independently. Gartner data from 2025 shows that nearly 40% of software purchases function as unmanaged maverick spend. This fragmentation creates financial volatility and heightens supply chain risk. Unmanaged spend lacks the protection of negotiated master service agreements and vendor performance tracking. The shift from reactive cost-cutting to proactive spend optimization requires centralizing these rogue transactions. Identifying these leakage points converts them into managed assets. Eliminating maverick spend isn't just about control; it's about reducing the total cost of ownership and stabilizing the tech stack.
SUM as a Metric for Procurement Maturity
As of late 2025, the average organization maintains 71% of its total enterprise spend under management. Top-performing procurement organizations manage over 90%. This disparity highlights the difference between basic operations and strategic excellence. High SUM scores correlate directly with superior EBITDA performance and margin expansion. Every dollar transitioned from an unmanaged to a managed state typically yields 6% to 12% savings during the initial contract period. Spend intelligence elevates the procurement function by providing granular data on historical pricing and market trends. Organizations that master these metrics move from transactional cost centers to strategic architects of business finance. This maturity ensures every procurement decision aligns with the enterprise's bottom-line goals.
How to Calculate Spend Under Management: A Clinical Formula
Calculating spend under management requires more than a simple division of total expenditures. To achieve reporting integrity, you must first isolate addressable spend from total organizational outflow. The clinical formula is: (Managed Spend / Total Addressable Spend) x 100. This calculation provides a percentage that reflects the maturity of your procurement architecture. To execute this with precision, you'll need to aggregate data from ERP systems, P-cards, and accounts payable ledgers. Data normalization ensures that currency fluctuations and inflationary pressures don't skew your performance metrics. High-level decision-makers must strip away non-addressable liabilities, such as taxes, debt service, and intercompany transfers, to reveal the true denominator. The federal government's Spend Under Management Tiered Maturity Model provides a robust framework for categorizing these tiers of control.
Accuracy in this metric depends on clinical data verification. Raw accounts payable files often contain duplicates or miscategorized entries that inflate unmanaged spend figures. Leveraging procurement category cost benchmarking and analytics allows you to normalize this data against global market indices. This process identifies exactly where maverick purchasing is occurring. By removing non-addressable items, you ensure that your SUM percentage accurately reflects the procurement team's strategic influence. This isn't a passive accounting exercise; it's a rigorous audit of financial control.
Defining "Managed" Spend Criteria
Managed spend is a status earned through rigorous oversight, not a default accounting category. To be classified as "managed," spend must meet three clinical requirements. First, the expenditure must be governed by a formal contract or a documented sourcing plan. Second, the spend must undergo regular strategic reviews using advanced procurement analytics to ensure market alignment. Third, the organization must verify that it's actually receiving the contracted rates, terms, and SLAs. If a purchase occurs under a contract but at the wrong price point, it remains functionally unmanaged. This verification step is what separates world-class procurement teams from those simply processing transactions.
Step-by-Step Data Collection Framework
Success begins by aggregating fragmented spend data from disparate global tech stacks into a single source of truth. Organizations must categorize this data using AI-led spend analysis tools to identify hidden leakage points. Once categorized, you should apply should-cost modeling to benchmark your managed spend opportunities against real-world market data. This framework allows you to prioritize high-volume, low-complexity categories for immediate optimization. By following this methodical approach, you convert raw financial data into actionable spend intelligence. This visibility is what enables the strategic architect to drive continuous margin expansion across the enterprise.
Maverick Spend vs. Strategic Managed Spend: Overcoming the 100% Myth
Achieving 100% spend under management sounds like an ideal objective, but it often represents a strategic failure in resource allocation. In the pursuit of clinical margin expansion, the "100% Myth" ignores the reality of diminishing returns. Managing every single transaction, such as low-value office supplies or one-off local services, creates an administrative burden that frequently outweighs the potential savings. World-class procurement architects recognize that the cost of management must never exceed the value of optimization. Instead, they apply the 80/20 rule, focusing their most sophisticated analytics on the 20% of categories that drive 80% of the total value. This ensures that expert negotiators spend their time on high-impact contracts where market price trending and forecasting can yield the highest ROI.
Strategic architects must also account for "non-addressable" spend without sacrificing overall financial visibility. Categories like government taxes, utility monopolies, and certain regulatory fees are non-negotiable by nature. While these expenditures should be tracked within your spend intelligence platform for total cost visibility, attempting to apply a sourcing framework to them is a waste of human capital. Maintaining a clinical distinction between addressable and non-addressable spend allows procurement teams to report more accurate SUM percentages. This clarity prevents the dilution of performance metrics and keeps the focus on areas where active management can actually drive margin growth.
Tail Spend Management: The Hidden 20%
Tail spend typically accounts for 20% of an organization's expenditure but represents 80% of its total supplier base. This fragmentation is where most maverick purchasing occurs. To increase spend under management without increasing manual effort, organizations must transition to automated sourcing workflows. By leveraging the strategies in Tail Spend Management: Addressing the Hidden 20%, firms can implement RFQ sprints to capture value in these unmanaged categories. These high-intensity cycles use standardized templates to bid out high-volume, low-complexity categories rapidly. Automation ensures that tail spend remains governed by contracted terms without requiring constant oversight from senior category managers.
The Economic Impact of Maverick Spend
Maverick spend is the primary obstacle to clinical margin expansion. When employees bypass formal procurement channels, they trigger a "leakage" cost that directly erodes the 6% to 12% savings procurement typically secures during initial contract periods. This unmanaged behavior creates significant price risk by exposing the enterprise to spot-market volatility and inconsistent vendor terms. Without the protection of negotiated master service agreements, the organization loses its ability to track vendor performance accurately. This financial volatility disrupts budget forecasting and weakens the enterprise's negotiation leverage in future RFP cycles. Eliminating this leakage is essential for maintaining a stable and optimized cost structure.
Strategies to Increase SUM: From Analytics to Execution
Increasing your spend under management requires a transition from passive tracking to clinical execution. AI has become a top priority in 2026, serving as the primary engine for identifying unmanaged opportunities within fragmented data sets. AI-led spend analytics scan millions of transaction lines across legacy ERPs to surface leakage points that traditional accounting methods miss. These tools identify categories where maverick purchasing occurs, allowing procurement architects to centralize control. Increasing spend under management through high-intensity RFQ sprints targets high-volume, low-complexity goods and services. This process applies clinical competitive pressure to secure the 6% to 12% savings typically found during initial contract periods. Success depends on a clinical execution framework that treats every contract renewal as a strategic opportunity for margin expansion.
Advanced Benchmarking and Spend Intelligence
Validating managed rates requires more than comparing year-over-year costs. Organizations must integrate Procurement Analytics: Data-Driven Cost Optimization into their SUM roadmap to achieve true spend intelligence. This involves using procurement category cost benchmarking to ensure contracted prices align with real-world market indices. Should-cost models provide a "clean sheet" view of what a product or service should cost based on raw material, labor, and overhead inputs. This data-driven approach removes the guesswork from negotiations and ensures that "managed" spend is actually "optimized" spend. High-level decision-makers use these analytics to prove procurement ROI and justify the 13.2% CAGR investment in spend management platforms.
Price Risk Management as a Managed Spend Lever
Managing commodity indexing is essential to prevent price creep in existing contracts. Many organizations lose their hard-won savings because they fail to track market volatility after the contract is signed. Price risk management services ensure long-term margin stability by linking contract pricing to objective market benchmarks. This proactive price risk tracking moves the procurement function from reactive purchasing to strategic financial architecture. By monitoring market price trending and forecasting, you can anticipate shifts before they impact the bottom line. This integration of risk management and SUM is what separates sophisticated partners from transactional vendors. To secure your competitive advantage, utilize our market price trending and forecasting service to stabilize your cost structures against global disruptions.
RightCostIQ: Clinical Precision in Spend Optimization
RightCostIQ functions as the technical architect for enterprises seeking to move beyond passive accounting. We provide the clinical infrastructure required for AI-led spend under management optimization, ensuring every dollar is governed by strategic intelligence. Unlike generic consulting firms that offer high-level advice, we deliver action-oriented RFP management and negotiation assistance. Our methodology relies on data-driven cost benchmarking rather than anecdotal evidence. Through the RightCost Academy, we also provide the technical upskilling necessary for teams to master should-cost modeling and commodity indexing. This ensures your procurement function remains a sophisticated mentor for long-term financial health. Procurement is the new value driver, and our role is to provide the precision tools to execute that vision.
High-level decision-makers require a partner that prioritizes results and efficiency over conversational warmth. Our platform integrates modern technological terminology like prompt engineering and AI-led analytics into traditional procurement workflows. This tech stack bridges the gap between fragmented legacy ERP data and cutting-edge SaaS innovation. By treating procurement as an architectural lever, we help you build a relentless focus on the bottom line. Our expert-led emotional style signals a high level of competence, ensuring your organization remains competitive in a post-pandemic economy where savings have once again become the top priority for CPOs. Every service we offer is designed to packs maximum information into short, action-oriented sprints.
Our Framework for Margin Expansion
Our methodology follows a methodical three-step process designed for maximum efficiency. Step one involves an AI-led spend analysis to identify the addressable gap between current and world-class performance. This clinical audit surfaces the maverick spend that erodes your bottom line. Step two utilizes high-intensity RFQ sprints and our RFP Management: Precision Frameworks for Sourcing to secure market-leading terms. Finally, step three establishes continuous vendor performance tracking and price risk management to protect your gains. This holistic approach ensures that high-level strategy and technical execution remain perfectly aligned throughout the contract lifecycle.
Achieving Clinical Results
The ROI of professional RFP management is most evident in complex global supply chains where data fragmentation is highest. In a recent 2025 engagement, we helped a North American manufacturing client expand their enterprise margins by 15% through a rigorous spend under management audit and category optimization. By consolidating fragmented legacy data and applying clinical negotiation pressure, we converted unmanaged tail spend into a strategic asset. This result demonstrates the power of shifting from transactional purchasing to a managed state. Professional negotiation assistance doesn't just cut costs; it builds a resilient financial architecture. Schedule a clinical spend analysis with RightCostIQ to begin your roadmap toward AI-led margin expansion.
Architecting an Optimized Financial Future
Procurement is the new value driver, and the roadmap to margin expansion requires moving beyond basic accounting entries. You've seen how top-performing organizations manage over 90% of their addressable spend to yield 6% to 12% initial savings. Eliminating the 40% maverick spend leakage identified by Gartner ensures your financial architecture remains stable and predictable. Mastering spend under management isn't just about visibility; it's about clinical optimization across the entire enterprise tech stack.
RightCostIQ provides North American coverage with clinical precision, utilizing proprietary should-cost modeling to validate every line item against market indices. Our expert-led RFP sprints deliver rapid margin expansion by applying intense competitive pressure to your high-volume categories. This methodical approach converts fragmented data into a sophisticated managed state, providing the ultimate competitive advantage in a volatile economy. Optimize your Spend Under Management with RightCostIQ’s AI-Led Analytics to secure your bottom line. Your journey toward a more efficient procurement function starts with data-driven precision.
Frequently Asked Questions
What is a good percentage for spend under management?
A benchmark of 80% to 90% represents a high-performing procurement function. While the 2025 global average remains near 71%, top-tier organizations strive to exceed the 90% threshold to maximize their strategic influence. Crossing the 85% mark typically indicates that an organization has successfully centralized its core categories and eliminated significant maverick purchasing. Achieving 100% is rarely the goal because the administrative cost of managing low-value tail spend often outweighs the potential savings.
How does spend under management differ from total spend?
Spend under management focuses exclusively on addressable expenditures governed by procurement, whereas total spend includes every dollar leaving the enterprise. Total spend encompasses non-negotiable liabilities such as corporate taxes, debt interest, and depreciation. SUM targets only those categories where active sourcing, negotiation, and vendor performance tracking can influence the bottom line. This distinction ensures that procurement teams focus their sophisticated analytics on areas where they can drive actual margin expansion.
Can software alone increase spend under management?
No, software provides the necessary visibility, but strategic execution drives the actual increase in SUM. While the spend management platform market is growing at a 13.2% CAGR, these tools are only as effective as the processes behind them. Organizations must combine AI-led analytics with professional RFP management and negotiation assistance to transition unmanaged data into a managed state. Software identifies the leakage, but human expertise secures the optimized contracts.
What are the main challenges in measuring SUM accurately?
Data fragmentation across disparate legacy ERP systems remains the primary obstacle to accurate measurement. Inconsistent categorization and the presence of maverick spend make it difficult to establish a clean source of truth for addressable expenditure. Clinical data normalization is required to remove non-addressable items and duplicates. Without this rigorous audit, organizations often overstate their managed spend or fail to identify hidden opportunities in their tech stack.
How does SUM impact an organization’s bottom line?
Increasing spend under management directly expands EBITDA margins by capturing value typically lost to spot-market volatility. Bringing a previously unmanaged category under procurement oversight yields an average savings of 6% to 12% during the initial contract period. These gains provide a clinical engine for enterprise-wide margin expansion and financial stability. High SUM percentages also improve budget forecasting accuracy by reducing the frequency of unmanaged, off-contract transactions.
Is tail spend included in spend under management calculations?
Yes, tail spend is a vital component of the spend under management denominator. Although tail spend often accounts for only 20% of total expenditure, it frequently represents 80% of the supplier base, making it a hotbed for maverick purchasing. Mature organizations use automated RFQ sprints to bring these high-volume, low-complexity categories under management. This ensures that even small transactions are governed by negotiated terms without increasing the manual workload of senior category managers.
What is the role of AI in optimizing spend under management?
AI-led analytics surface hidden leakage points by scanning millions of transaction lines with clinical precision. In 2025, AI became the primary priority for CPOs because it enables real-time spend intelligence and predictive risk forecasting. These tools allow procurement architects to categorize data instantly and identify where contracted rates aren't being applied. AI transforms procurement from a reactive, administrative function into a proactive driver of financial optimization and margin growth.
How often should an organization report on SUM metrics?
Quarterly reporting is the standard for mature procurement teams, though monthly tracking is essential for high-growth firms. Regular cadences ensure that maverick spend doesn't accumulate and that realized savings align with negotiated terms. Frequent reporting allows the strategic architect to adjust sourcing plans based on market price trending and forecasting data. This consistent oversight ensures that the procurement function remains perfectly aligned with the organization’s long-term financial objectives.