
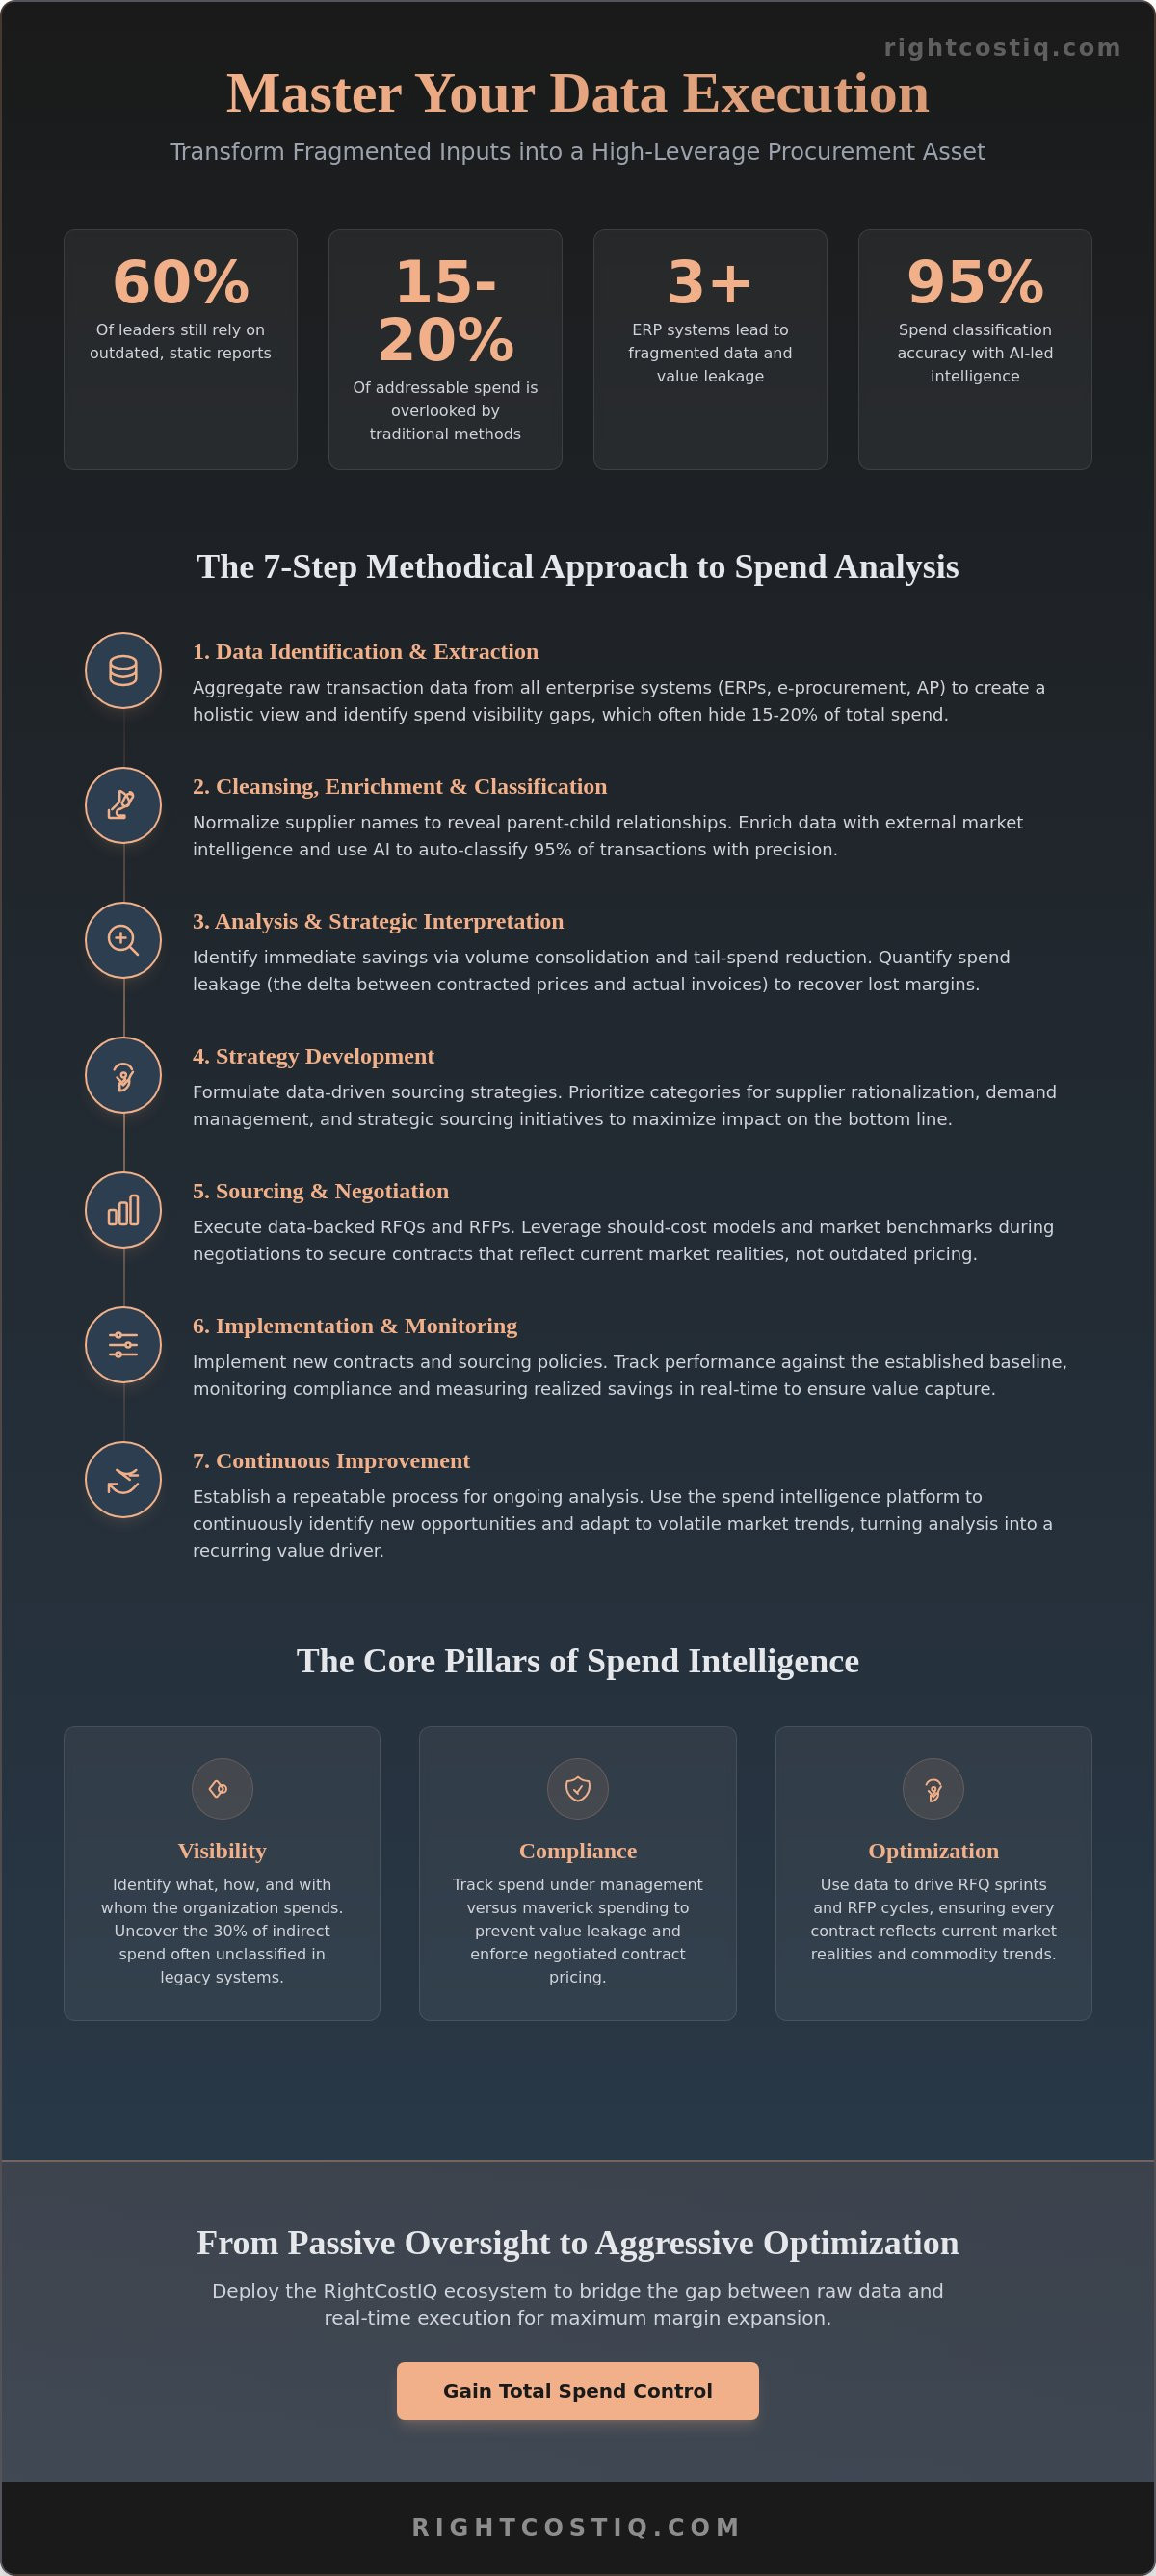
According to recent industry benchmarks, 60% of procurement leaders still rely on static reports that fail to capture maverick spend in real time. You likely recognize that fragmented data across three or more ERP systems isn't just an administrative hurdle; it's a direct leak in your bottom line. Procurement is the new value driver, yet many organizations remain trapped in reactive cycles because their spend analysis lacks the clinical precision required for high-stakes negotiation.
This article provides the strategic framework to master your data execution, transforming fragmented inputs into a high-leverage procurement asset. You'll learn how to establish a single source of truth that identifies immediate savings opportunities and benchmarks costs against volatile market trends. We'll examine the transition from manual reporting to AI-led intelligence, ensuring your tech stack delivers the margin expansion your stakeholders demand. By the end of this guide, you'll have the roadmap to move from passive oversight to aggressive, data-driven optimization.
Key Takeaways
- Shift from reactive reporting to proactive spend intelligence, positioning procurement as a clinical driver for margin expansion.
- Execute a methodical 7-step framework designed to transform fragmented ERP data into high-leverage strategic insights.
- Utilize advanced spend analysis and should-cost modeling to move beyond historical data and identify market price outliers.
- Neutralize the "dirty data" objection by prioritizing strategic visibility and AI-led classification over the pursuit of perfect data.
- Deploy the RightCostIQ ecosystem to bridge the gap between raw expenditure data and real-time RFP execution for maximum optimization.
What is Spend Analysis? Defining the New Value Driver
Spend analysis is the clinical process of collecting, cleansing, and classifying expenditure data to optimize procurement outcomes. It functions as the diagnostic engine of the modern enterprise. By the year 2026, the global supply chain requires a shift from reactive reporting to proactive spend intelligence. This evolution enables aggressive margin expansion. Traditional methods often overlook 15% to 20% of addressable spend due to fragmented data silos. AI-led analytics solve this by identifying hidden cost variances across the entire enterprise. Understanding What is Spend Analysis? is the first step in building a resilient financial architecture. It provides the empirical evidence needed for should-cost modeling and commodity indexing.
Procurement is the new value driver. The role of the Chief Procurement Officer has shifted from a back-office support function to a strategic architect of the bottom line. Organizations that treat spend data as a static record lose competitive advantage. Instead, high-performance firms utilize AI-led frameworks to turn every transaction into a data point for future negotiation. This systematic approach ensures that capital allocation aligns with strategic objectives, transforming procurement into a profit center rather than a cost center. It's about moving from historical observation to predictive financial engineering.
The Core Pillars of Spend Intelligence
Visibility serves as the primary pillar. It identifies what, how, and with whom the organization spends. Granular visibility reveals that 30% of indirect spend often goes unclassified in legacy systems. Compliance is the second pillar. It tracks spend under management versus maverick spending to prevent value leakage. Finally, optimization uses data to drive RFQ sprints and RFP cycles. This ensures that every contract reflects current market realities and commodity indexing trends, rather than outdated pricing models.
Spend Analysis vs. Spend Management
Analysis is the diagnostic phase while management is the execution. Attempting to manage spend without a data-driven baseline is an exercise in inefficiency. It results in missed opportunities for consolidated volume discounts and vendor rationalization. Integrating spend intelligence into the broader procurement tech stack creates a seamless flow from insight to action. This integration allows for real-time adjustments during RFQ sprints. It bridges the gap between high-level strategy and technical execution, ensuring that margin expansion targets are met with clinical precision.
The 7-Step Methodical Approach to Spend Analysis
Executing a clinical spend analysis framework transforms fragmented ERP data into a high-velocity engine for margin expansion. This process isn't a passive accounting exercise; it's a strategic architecture designed to eliminate waste and identify leverage. By deploying a systematic 7-step methodology, procurement leaders move from descriptive reporting to prescriptive action. This framework prioritizes data integrity and automated classification to reduce manual cycle times by 60% compared to traditional spreadsheet-based models.
Data Identification and Extraction
The foundation of spend intelligence rests on the clinical aggregation of data from every corner of the enterprise. This involves extracting raw transaction files from ERPs, e-procurement systems, and accounts payable ledgers. A holistic view must capture direct materials, indirect goods, and complex services spend. Enterprise data silos typically obscure 15% to 20% of total spend visibility. Identifying these gaps is critical to ensure the final dataset represents the absolute truth of corporate outflows.
Cleansing, Enrichment, and Classification
Raw data is inherently noisy. Normalizing supplier names is a mandatory step to identify parent-child relationships and aggregate total enterprise volume. AI-led enrichment adds external intelligence, such as commodity indexing and market price trending data, which provides context to internal costs. We then classify spend using standard taxonomies like UNSPSC or custom category frameworks. This automated classification ensures that 95% of transactions are accurately categorized, preparing the foundation for advanced procurement category cost benchmarking and should-cost modeling.
Analysis and Strategic Interpretation
Strategic interpretation focuses on identifying immediate savings through volume consolidation and tail-spend reduction. We analyze payment term gaps to optimize working capital and improve cash flow. Spend leakage is the delta between contracted prices and actual invoices. By quantifying this delta, procurement teams can recover lost margins and tighten contract compliance. This analysis ensures the output is immediately actionable for upcoming RFQ sprints. Procurement teams utilizing advanced spend intelligence often realize a 4x ROI within the first 12 months of implementation. This methodical approach turns historical data into a forward-looking roadmap for negotiation and financial optimization.
Advanced Spend Analytics: Should-Cost Modeling and Benchmarking
Legacy systems focus on the rearview mirror. They catalog historical transactions without context. Strategic architects use advanced spend analysis to determine what costs should be, not just what they were. This transition identifies market outliers where companies pay 12% to 18% above median market rates. Commodity indexing integrates real-time data from global exchanges to project future price volatility. This foresight transforms procurement from a reactive function into a primary value driver for margin expansion. It's about moving from passive reporting to active spend intelligence.
Data-driven negotiation requires a shift in perspective. You aren't just buying a product; you're buying a supplier's cost structure. Advanced analytics allow firms to:
- Isolate price variances across disparate business units.
- Leverage commodity index data to hedge against 5% to 10% inflationary spikes.
- Force transparency during high-stakes RFP management.
- Optimize the tech stack to automate data ingestion.
This methodology eliminates the guesswork that plagues traditional procurement. When you understand the underlying cost drivers, you gain an objective edge. You're no longer negotiating based on "feelings" or "long-term relationships." You're negotiating based on the clinical reality of the market. This precision ensures that every dollar spent is aligned with optimized margin targets.
Clinical Benchmarking Standards
Benchmarking requires more than surface-level comparisons. It demands a clinical assessment of category costs against industry-specific trends. Procurement teams use these standards to isolate "best-in-class" pricing, typically found in the 75th percentile of efficient buyers. When a firm identifies a 22% gap between their current state and optimized market pricing, the spend analysis provides the objective evidence needed to initiate an RFQ sprint. It's about closing the distance between average performance and market leadership through data-backed decisions.
Should-Cost Modeling for Negotiation Assistance
Clean-sheet cost models deconstruct supplier pricing into granular components. This includes raw materials, direct labor, and manufacturing overhead. This transparency allows firms to challenge supplier margin assumptions with mathematical precision. It's a technical discussion about inputs. During contract renewal cycles, integrating market price trending data ensures that price decreases in the global supply chain are captured immediately. This prevents margin erosion and secures a competitive advantage by ensuring suppliers don't retain windfall profits from falling commodity prices.
Overcoming the "Dirty Data" Objection in Procurement
Data fragmentation is the primary barrier to high-velocity margin expansion. Many procurement leaders stall critical initiatives while waiting for a "perfect" data environment. This delay is a strategic failure. Waiting for clean data before implementing spend analysis protocols results in an average 15% loss in addressable savings annually. AI-led data remediation transforms fragmented legacy systems into actionable intelligence without requiring a multi-year ERP overhaul. By applying automated validation protocols, organizations achieve 98% classification accuracy within weeks. Procurement is the new value driver, and it's built on the ability to extract clinical insights from existing, imperfect datasets.
The Myth of the Clean ERP
Manual data entry is inherently flawed. Industry benchmarks indicate that 25% of manual ERP entries contain classification errors or missing metadata. This creates the "Garbage In, Garbage Out" cycle that paralyzes decision-making. Automated validation replaces human error with algorithmic precision. We use prompt engineering to refine spend categories, turning raw invoice descriptions into structured data points. This process doesn't just clean the data; it enriches it with external market intelligence.
- Automated Normalization: AI identifies that "IBM," "Intl Business Machines," and "IBM Corp" are the same entity, consolidating tail spend instantly.
- Categorization at Scale: Machine learning models map unstructured GL codes to standard taxonomies like UNSPSC with 95% consistency.
- Real-time Validation: Systems flag duplicate invoices and tax errors before they impact the bottom line.
Continuous Spend Monitoring
Annual audits provide a retrospective view that's often too late to impact the current fiscal year. Continuous spend analysis shifts the focus to real-time visibility. It's about moving from historical reporting to active margin management. Setting up automated alerts for maverick spend and price variances ensures data remains objective and actionable for C-suite reporting. When a vendor increases prices by 4% outside of contract terms, the system flags it immediately, not six months later during a quarterly review.
Building a resilient data architecture involves tracking vendor performance against 50+ unique KPIs. This creates a clinical feedback loop where procurement strategy and technical execution are perfectly aligned. High-level margin expansion requires this level of granular, real-time control over every dollar leaving the organization. Don't let the pursuit of perfect data stop you from achieving 10% to 20% margin improvements today.
Implementing Spend Intelligence with RightCostIQ
RightCostIQ functions as the Strategic Architect for organizations seeking AI-Led Margin Expansion. We don't just provide software; we deliver a comprehensive framework that turns raw data into a competitive advantage. Our platform integrates RFP management with real-time spend analytics to close the loop between the identification and realization of savings. This AI-driven optimization targets the entire procurement lifecycle, ensuring every transaction aligns with broader corporate financial goals. By deploying our tech stack, firms move beyond passive reporting into active margin management.
The RightCost Academy serves as a technical mentor for your procurement team. We focus on technical upskilling in areas like prompt engineering and advanced commodity indexing. This ensures your staff operates at the high level of competence required to manage a modern, AI-led environment. We treat procurement as the new value driver, empowering decision-makers to move with strategic urgency. Our methodology isn't about incremental gains; it's about institutionalizing a culture of clinical precision and data-driven results.
From Analysis to RFQ Sprints
High-velocity sourcing events are the natural evolution of deep spend analysis. RightCostIQ facilitates RFQ sprints that condense months of traditional negotiation into weeks of targeted action. These sprints utilize clinical cost benchmarking to provide negotiators with a distinct data advantage. We use should-cost modeling to strip away supplier margins and focus on the true cost of components. This level of precision ensures sourcing decisions are objective and backed by hard data. Every event is designed to be a value driver that contributes directly to the bottom line.
Next Steps for Strategic Procurement
Assessing your spend under management maturity is the first step toward total optimization. Industry data shows that organizations operating without AI-led tools often have less than 45% visibility into their indirect spend. A diagnostic spend analysis often reveals that up to 14% of contract value is lost to non-compliance or unoptimized pricing structures. RightCostIQ provides the tools to recapture this value through a structured, methodical approach to data evaluation.
To begin your transition to a high-maturity procurement model, consider these immediate actions:
- Evaluate your current tech stack against AI-driven margin expansion benchmarks.
- Identify category-specific leakage through a clinical diagnostic of your historical data.
- Contact RightCostIQ for a clinical evaluation of your procurement data to identify immediate savings opportunities.
Strategic procurement requires more than just better tools; it requires a new philosophy of spend intelligence. RightCostIQ delivers the expertise and the technology to make that transition seamless and profitable.
Mastering the New Value Driver of Procurement
Effective spend analysis is the foundation of modern financial resilience. Organizations that move beyond basic categorization to adopt AI-led margin expansion frameworks can identify hidden inefficiencies that traditional audits miss. By integrating specialized healthcare financial analytics and should-cost modeling, procurement leaders transition from cost centers to strategic architects. The 7-step methodical approach ensures data integrity, even when dealing with fragmented legacy systems. Leveraging a proprietary RFQ Sprint methodology allows teams to execute high-stakes negotiations in 30 days or less. This represents a significant acceleration over standard 90-day procurement cycles. This shift in operational strategy isn't just about cost cutting; it's about precision engineering your bottom line. Data-driven organizations aren't waiting for market shifts to improve their ratios. They're using sophisticated spend intelligence to dictate their financial future today. Procurement is the new value driver, and the right tech stack makes that vision a reality. It's time to turn your dirty data into a quantifiable competitive advantage.
Optimize your margins with RightCostIQ’s AI-led procurement analytics
Your path to optimized margins starts with the right data strategy.
Frequently Asked Questions
What is the primary difference between spend analysis and spend analytics?
Spend analysis focuses on the systematic review of historical expenditure data to identify cost-saving opportunities. In contrast, spend analytics leverages that data through AI-led modeling to predict future trends and automate decision-making processes. Analysis provides the foundation of truth; analytics provides the strategic engine for margin expansion. Most enterprises transition from manual analysis to automated analytics to capture 10% to 15% in additional annual savings.
How often should an enterprise conduct a comprehensive spend analysis?
Enterprises must conduct a comprehensive spend analysis monthly to maintain real-time visibility into shifting market dynamics. Static annual reviews leave organizations vulnerable to a 5% to 8% margin erosion due to unmonitored price fluctuations. By integrating AI-led spend intelligence into your tech stack, procurement teams shift from reactive quarterly reporting to continuous monitoring. This frequency ensures every RFQ sprint is backed by the most current commodity indexing data available.
Can spend analysis identify maverick spend in real-time?
AI-led spend analysis platforms identify maverick spend instantly by flagging transactions that deviate from pre-negotiated contract terms or preferred supplier lists. These systems use pattern recognition to detect non-compliant behavior within 24 hours of a purchase order submission. Organizations using automated spend intelligence typically reduce tail spend leakage by 25% within the first six months. This real-time visibility transforms procurement from a back-office function into a primary value driver.
What are the most common KPIs tracked in a clinical spend analysis?
Clinical spend analysis prioritizes KPIs such as spend under management, contract compliance rates, and price variance across multiple facilities. Procurement leaders also track the ratio of physician-preference items to standardized inventory to identify standardization opportunities. Tracking these metrics typically reveals a 12% to 18% savings potential in medical-surgical categories. High-performing health systems utilize should-cost modeling to benchmark clinical supplies against national commodity indexing data for maximum margin expansion.
How does AI-led spend analysis improve data classification accuracy?
AI-led spend analysis improves data classification accuracy by using machine learning algorithms to categorize line-level data with 95% or higher precision. Traditional manual classification often results in a 30% error rate due to inconsistent vendor naming and fragmented ERP systems. AI-driven engines utilize prompt engineering and neural networks to map disparate data points to standard taxonomies like UNSPSC. This high-fidelity data serves as the critical foundation for executing successful RFQ sprints.
What is the typical ROI for implementing a professional spend analysis platform?
Implementing a professional spend analysis platform typically yields a 5x to 10x return on investment within the first 12 months. Organizations realize these gains through a combination of 10% reduction in maverick spend and improved supplier negotiation leverage. By automating data ingestion, procurement teams reallocate 40% of their time from manual data cleaning to strategic margin expansion activities. Procurement is the new value driver when backed by a tech stack that delivers actionable spend intelligence.
How do you handle spend analysis for global organizations with multiple currencies?
Global spend analysis requires a centralized tech stack that automatically normalizes multiple currencies using daily spot rates or weighted average exchange rates. This process ensures that procurement leaders view total global expenditure through a single, unified lens for accurate should-cost modeling. Advanced platforms integrate with 150+ global currency feeds to eliminate reporting discrepancies caused by FX volatility. Accurate currency normalization allows global firms to identify regional price variances of 15% or more for identical SKU sets.
What is tail spend and why is it often missed in basic analysis?
Tail spend represents the bottom 20% of total expenditure that accounts for 80% of an organization's suppliers. Basic analysis often misses these transactions because they're too small and numerous for manual procurement teams to manage effectively. Without AI-led automation, these low-value purchases result in a 10% to 15% hidden cost premium. Strategic architects use spend intelligence to aggregate this fragmented data, converting unmanaged tail spend into a structured source of margin expansion.