
Procurement performance is not captured by savings alone. Developing key performance indicators for procurement means choosing measurable indicators across cost, supplier performance, process efficiency, compliance, and spend control, then linking them to business goals. A strong set also tracks cost avoidance and value leakage, showing both the value secured and the spend that could undermine it.
Reported savings show one part of the picture, but prevented future costs and off-contract purchases reveal another. A focused KPI framework helps distinguish these outcomes and flag issues such as late deliveries, price variances, rising emergency purchases, or weak contract compliance.
This guide explains which procurement KPIs to use, how to define and calculate them, and how to combine related measures to spot problems early. It also shows how to track spend under management and distinguish cost avoidance from realized savings, giving your team a clearer view of procurement’s contribution to business performance.
Key Takeaways
- Choose measures that connect procurement activity to business outcomes, and define each KPI with an objective calculation and a clear target.
- Separate realized cost savings from cost avoidance to show both captured value and future spend prevented.
- Use supplier measures such as delivery reliability, quality and contract compliance to spot performance risks before they disrupt operations.
- Track managed spend alongside off-contract purchasing to identify gaps in procurement control and opportunities to reduce leakage.
- Read related indicators together: changes in price, emergency buying and invoice disputes can reveal issues that a single KPI may miss.
1. What types of KPIs and performance measures are used in procurement?
Procurement KPIs measure purchasing, sourcing, and supplier management against business outcomes. A balanced set covers cost, supplier performance, risk, process efficiency, and compliance. Start with measures tied to a decision, such as whether to renegotiate, address a delivery issue, or reduce reliance on a supplier. Building indicators around decisions keeps reporting focused on action.
Standard formulas make performance comparable. Procurement ROI is total cost savings divided by total procurement costs, multiplied by 100. Supplier defect rate is defective units divided by total units received, multiplied by 100; on-time delivery rate is on-time orders divided by total orders, multiplied by 100. Cost savings compare original cost with actual cost.
Supplier performance metrics should cover delivery, quality, and contract compliance. On-time-in-full measures whether deliveries arrive by the agreed date, complete and without quality defects. A delivery-schedule measure compares quoted and actual delivery times, including how often and by how much orders arrive early or late. Track supplier lead time from order acceptance to delivery to spot delays earlier.
Supplier risk measures expose dependency and continuity concerns. Track single-source suppliers, supplier availability, and spend concentration, then compare these indicators with category exposure. For example, a concentration calculation can show whether top-N suppliers account for 55% of procurement spend. Measure preferred supplier use by comparing eligible purchases routed through preferred suppliers with eligible spend overall.
Risk, sustainability, and ESG measures add non-financial context to cost and delivery results. Supplier performance data can include risk, news, and diversity information from third-party sources. A diversity-spend measure, for example, compares spending with diverse suppliers against total procurement spend. Pair these indicators with documented supplier requirements and evidence so the scorecard reflects observed performance rather than broad claims.
A supplier scorecard consolidates measures into a consistent review: delivery, defects, contract terms, risk, and improvement actions. Define each metric, its data source, owner, target, and review period. A supplier audit example reports 85% completion, with 68 of 80 planned audits completed. That result points to a specific follow-up: address the audits still outstanding.
Set targets based on business priorities, category conditions, and a reliable baseline, then assign a timeline and target date. The Centers for Medicare & Medicaid Services (CMS) worksheet also calls for defining both. Review supplier metrics at a cadence suited to the risk and data flow. Use each review to investigate variances, agree on corrective actions, and assess progress at the next review.
2. How do procurement cost avoidance KPIs capture prevented future spend?
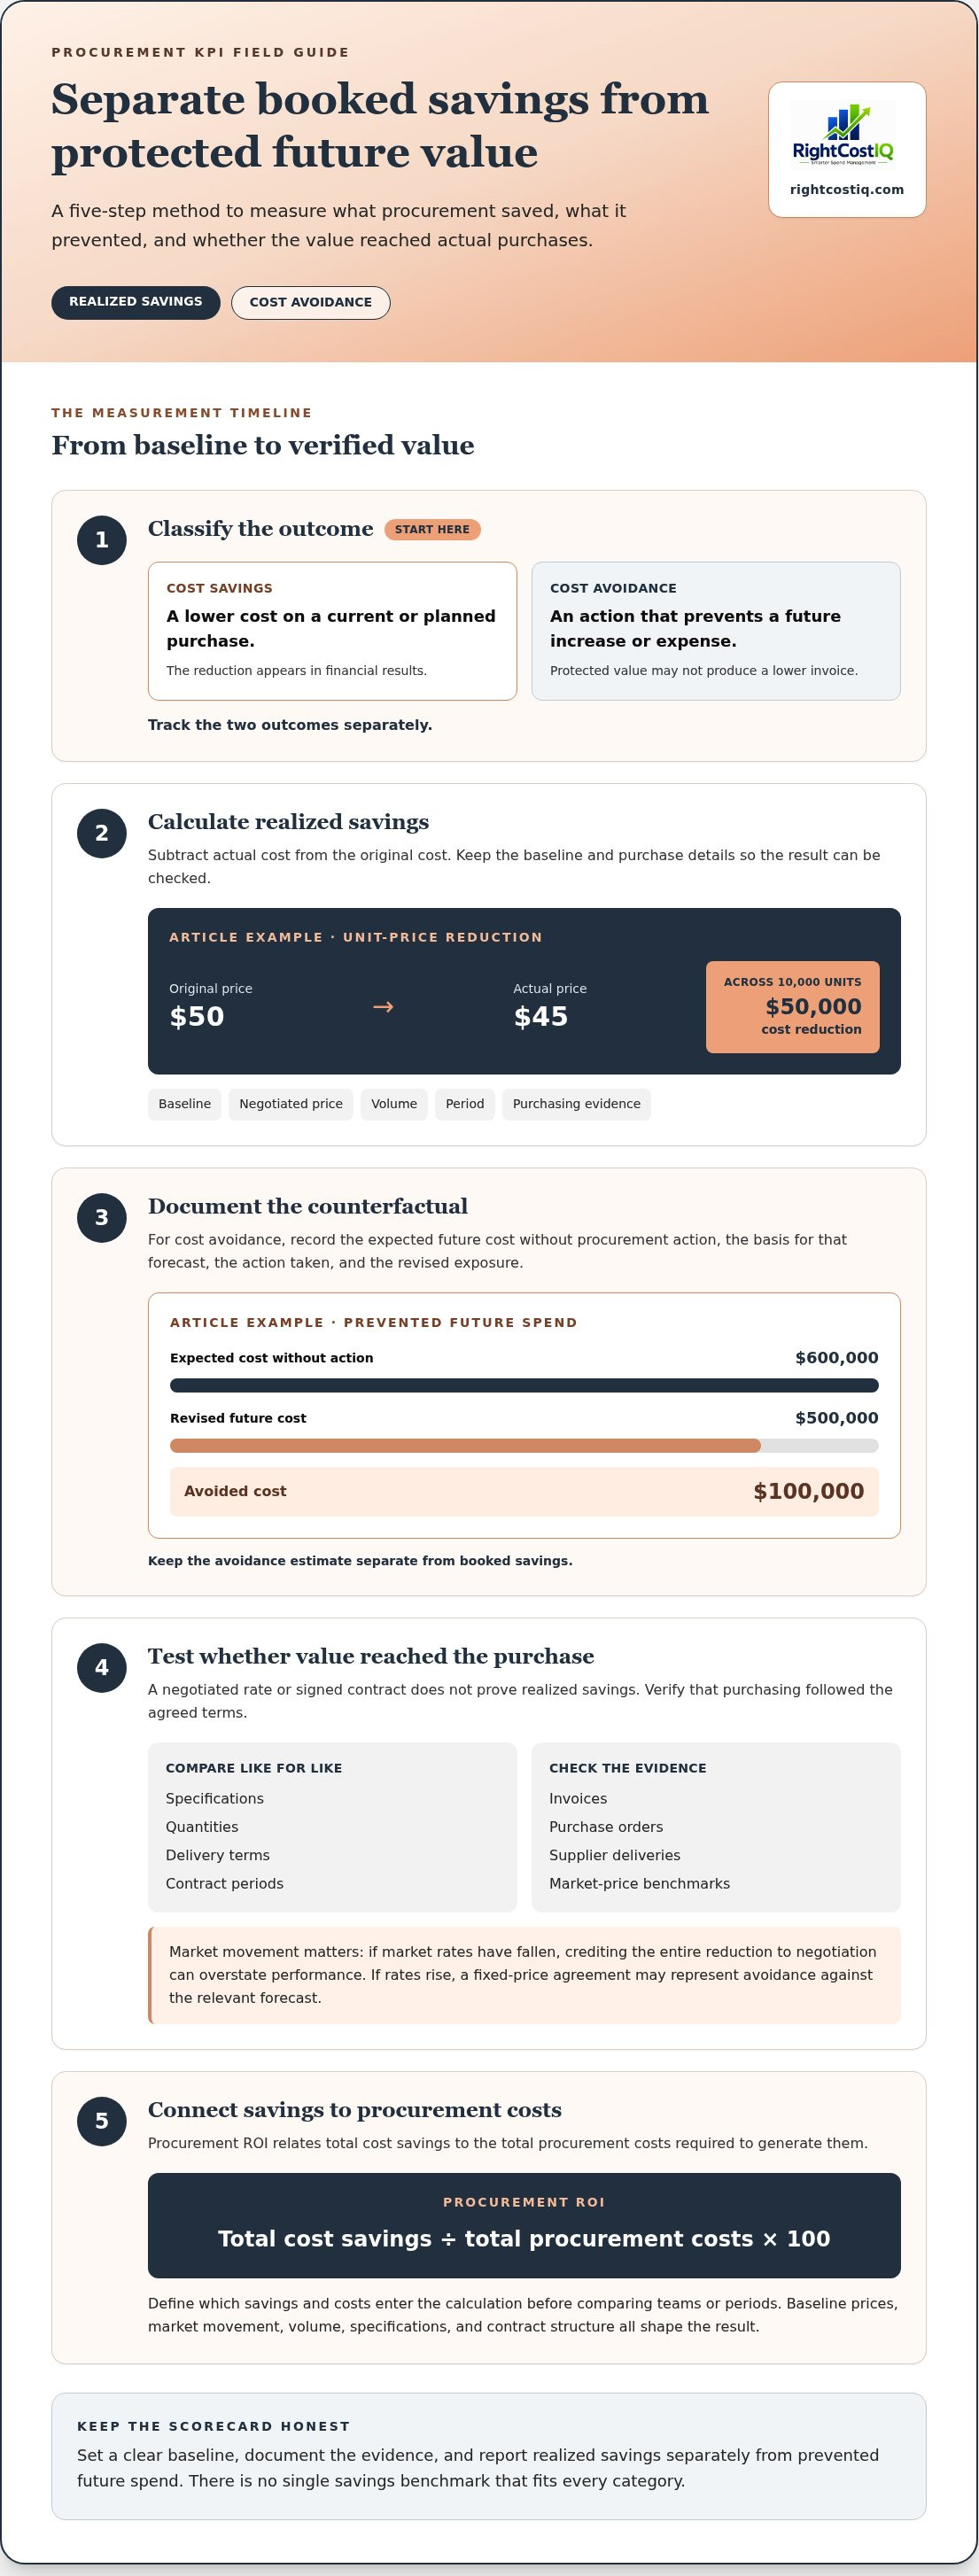
Cost savings and cost avoidance describe different financial outcomes. Savings reduce the cost of a current or planned purchase and appear in financial results. Cost avoidance records an action that prevents a future increase or expense, even when no lower invoice follows. Track them separately to distinguish realized savings from protected value.
For cost savings, subtract actual cost from the original cost. A unit-price reduction from $50 to $45 across 10,000 units illustrates $50,000 in cost reduction. Record the baseline, negotiated price, volume, period, and purchasing evidence. This prevents a change in volume or specification from being credited as a price saving.
Cost avoidance needs a documented counterfactual: the expected future cost without procurement action. If a procurement action lowers potential future cost from $600,000 to $500,000, the avoided cost is $100,000. Record the original forecast, its basis, the action taken, and the revised exposure. Keep the estimate separate from booked savings.
Competitive sourcing can produce either outcome. A competitive request for proposals may establish comparable bids, clarify specifications, and improve contract terms. Measure contract savings against a defined baseline, then check whether invoices, purchase orders, and supplier deliveries follow the negotiated terms. A signed rate reduction does not prove realized savings if purchases happen outside the agreement.
Price reductions also need context. Compare like-for-like specifications, quantities, delivery terms, and contract periods. Use market-price benchmarking to test whether the negotiated rate reflects market movement or procurement activity. If market rates have fallen, attributing the entire reduction to negotiation overstates performance. If rates rise, a fixed-price agreement may represent cost avoidance against the relevant forecast.
Procurement ROI connects savings to the resources required to generate them. Calculate total cost savings divided by total procurement costs, then multiply by 100. An illustrative calculation uses $600,000 in savings and $200,000 in procurement costs, producing an ROI of 3. Define which costs and savings enter the calculation before comparing teams or periods.
There is no single savings benchmark that fits every category; baseline prices, market movement, volume, specifications, and contract structure shape the result. For cycle time, the guide gives a 30-day standard guideline for purchase-order procurement and a 60-day standard guideline for contract procurement. Treat these as reference points, then interpret timing alongside sourcing complexity and value delivered.
Use a review record that links each claim to its baseline, calculation, evidence, owner, and reporting period. This creates a clear audit trail and strengthens the connection between procurement activity and reported value. Developing key performance indicators for procurement means treating prevented spend as a measured exposure, not as booked savings.
3. Spend under management
Spend under management shows how much company expenditure follows procurement’s approved processes. Calculate the rate by dividing managed spend by total spend, then multiplying by 100. The denominator should exclude staff costs when applying the managed-spend measure over a quarter. Define eligible spend consistently across categories, or changes in classification can distort comparisons between reporting periods.
Use both the percentage and the underlying amounts. For example, a managed-spend KPI can compare £300,000 spent through managed procurement processes with £400,000 in total spend over a quarter. This produces a 75% managed-spend rate. Many large organizations aim for up to 80% of spend under management, but the useful target depends on category scope and procurement maturity.
Contract compliance explains whether controlled spend delivers the agreed terms. Compare contract-compliant spend with total spend, then investigate purchases outside approved agreements. In an illustrative example, $680,000 of compliant spend out of $800,000 total spend gives an 85% contract compliance rate. A separate maverick-spend measure can expose off-contract buying: $120,000 in such spend out of $1,000,000 gives a 12% rate.
These metrics support strategic management when they connect procurement controls to stakeholder needs. A department may comply with a contract yet still receive late deliveries or a high defect rate. Pair managed-spend and compliance results with delivery, quality, and stakeholder satisfaction measures. Evaluate whether the approved supplier route meets operational requirements, then use feedback to identify process friction or unclear specifications.
Performance-management tools should make calculations actionable. A spend dashboard can group purchases by category, business unit, supplier, contract status, and reporting period. Link each exception to an owner and a next step, such as resolving a missing contract reference or reviewing repeated off-contract buying. Keep data definitions stable so category managers and finance teams interpret each measure consistently.
Build reviews around a repeatable sequence: set the spend boundary, calculate the baseline, identify unmanaged categories, and assign corrective actions. Then compare later periods using the same method. If managed spend rises while supplier delivery or quality worsens, investigate whether controls are directing demand toward unsuitable options. If compliance improves but stakeholder satisfaction falls, examine contract fit and purchasing workflows rather than treating a higher percentage as success on its own.
Spend under management is a control measure, not a complete measure of value. Pair it with savings, contract outcomes, supplier performance, and stakeholder feedback to assess whether procurement processes are delivering useful results. Together, these measures help leaders distinguish broader process coverage from genuine commercial and operational performance.
4. Combining KPIs to identify procurement problems early
One procurement KPI can hide the cause of a result. Combine measures of cost, process, supplier performance, and risk, then assess how they change together. For example, rising purchase price variance alongside longer supplier lead times may signal market pressure or a sourcing issue. Tracking both gives procurement a clearer basis for investigation than reviewing price alone.
Build a linked dashboard around business objectives, not a generic list. If continuity is the priority, pair supplier availability with single-source exposure and delivery performance. If working capital matters, assess inventory turnover alongside demand forecasts and emergency purchases. Each measure needs an owner, a data source, and an action threshold that triggers review.
There is no universally definitive ranking of the most important procurement KPIs. Industry conditions and procurement maturity shape which measures matter most. A team building basic data quality may start with purchase-order accuracy and contract compliance. A more mature function can connect price benchmarks, supplier risk, and spend forecasts to category decisions.
Align targets with company objectives and make each one specific, measurable, achievable, relevant, and time-bound. For example, a SMART target can reduce off-contract IT spend by 14 percentage points over two quarters. Set a baseline, define the eligible spend, assign an owner, and review progress against the stated deadline. This makes the target assessable rather than aspirational.
Common design mistakes include tracking too many measures, using inconsistent definitions, and rewarding outcomes that conflict with wider goals. The U.S. Environmental Protection Agency warns that too many KPIs can dilute improvement efforts and create unnecessary work. A low unit-price target, for example, may encourage choices that increase defects or delivery disruption. Keep measures focused and interpret them together.
External findings also show why objectives and data foundations matter. According to KPMG’s Global Procurement survey, 68% of respondents listed limited visibility and control over procurement workloads as a challenge. Deloitte’s 2023 Global Chief Procurement Officer survey found that 85% chose standardization of policies, processes, systems, and data as an orchestrator of procurement. Consistent definitions make KPI comparisons more meaningful.
Use a repeatable review sequence: compare actual results with targets, identify related movements, confirm the underlying cause, and assign corrective action. If emergency purchases rise while supplier availability falls, review sourcing coverage and risk exposure. Record the action and revisit the same metrics at the next review. Developing key performance indicators for procurement is most useful when combined measures prompt timely decisions.
5. Cost avoidance and value leakage
Procurement value can erode after a negotiated result through price changes, invoice disputes, unaccounted spend, or purchases outside agreed terms. Track these as leakage signals alongside savings and cost avoidance. The goal is to show whether planned commercial value survives ordering, invoicing, and supplier delivery, not just whether sourcing produced an attractive agreement.
Start with price integrity. Compare the price paid with the quoted or contracted price, then investigate each variance against the purchase order, invoice, and applicable terms. A recurring gap can point to outdated price files, incorrect contract references, or invoice errors. Record the cause and corrective action, then check whether the issue recurs in later transactions.
Invoice disputes provide another early warning. An illustrative calculation shows an 8% disputed invoice rate, based on 80 disputed invoices out of 1,000. Track the ratio over consistent reporting periods and classify disputes by cause, such as quantity, price, or contract terms. The rate identifies a pattern; the category analysis helps teams direct an operational fix.
New or unaccounted-for spend is also a useful KPI. Review spend records for transactions without a known category, contract, or sourcing rationale. Route each exception for classification, then assess whether it reflects a legitimate business need, a purchasing-channel gap, or a missed sourcing opportunity. This makes hidden spend visible before it becomes routine.
Cost avoidance measures a different form of value protection. Use this baseline to examine how a changed rate affects expected spend, while recording the assumptions and action behind the avoided increase. Keep forecasts separate from actual results so progress reports do not count projected protection as realized savings.
To assess effectiveness, connect each leakage metric to a control and an owner. A variance between the price paid and quoted should prompt a review of contract data and invoice handling. Unaccounted spend should prompt classification and sourcing reviews. Repeated disputes should trigger a supplier or process discussion. These links turn metrics into an improvement cycle rather than a dashboard that only reports problems.
Review trends using consistent definitions, transaction evidence, and an agreed follow-up date. If a leakage rate changes, investigate its drivers before attributing the movement to procurement performance. The clearest measure of progress combines prevented future spend, verified savings, and evidence that recurring leakage has been corrected. This connects procurement activity to commercial outcomes and supports more reliable decisions.
RightCostIQ: Request For Proposal (RFP) Management and Negotiation Assistance
RightCostIQ helps procurement teams connect KPI findings to sourcing decisions. Its Request For Proposal (RFP) Management and Negotiation Assistance helps structure competitive sourcing and negotiations. Procurement Category Cost Benchmarking and Analytics helps teams assess category pricing, while Procurement and Vendor Performance Tracking supports ongoing supplier measurement. Price Risk Management and Tracking and Market Price Trending and Forecasting address price exposure and market movement.
Use these services when KPI reviews reveal pricing gaps, supplier performance issues, or future cost risks that need closer analysis. The right starting point depends on what your measures show, whether that is an upcoming sourcing event or a need to track supplier performance more consistently.
Contact RightCostIQ to discuss your procurement priorities.
Turn procurement insight into your next decision
Make KPI ownership part of your operating rhythm. Assign someone to interpret each result, connect exceptions to decisions, and bring unresolved issues into category planning. This turns developing key performance indicators for procurement into an ongoing management discipline, not a reporting exercise that ends when dashboards are updated.
When your team needs help translating findings into commercial action, RightCostIQ’s Request For Proposal (RFP) Management and Negotiation Assistance, Procurement Category Cost Benchmarking and Analytics, and Procurement and Vendor Performance Tracking support sourcing, pricing, and supplier measurement. These services can help teams refine their analysis or prepare for procurement decisions.
Discuss your procurement priorities with RightCostIQ and identify a practical next step. A focused decision today can help build a more accountable, value-led procurement function over time.
Frequently Asked Questions
What types of KPIs and performance measures are used in procurement?
Procurement KPIs commonly measure commercial outcomes, process execution, supplier delivery, compliance, and risk. Select measures based on the decisions each category requires. For a critical component, a team might prioritize supply continuity and defect trends; for a frequently purchased service, it might assess price competitiveness and contract adherence. Pair leading indicators, such as supplier availability, with outcome measures, such as realized savings, to see both exposure and results.
Why measure the efficiency of your procurement process?
Efficiency measures show where work slows down, builds up, or creates avoidable rework. If requisitions wait for approval while sourcing decisions move quickly, the bottleneck is internal rather than supplier-related. Tracking time at each stage helps teams assign process improvements to the right owner. It also shows whether a faster process maintains purchase-order accuracy, appropriate controls, and stakeholder requirements instead of sacrificing them for speed.
How can procurement KPIs drive continuous improvement?
KPIs drive improvement when every unfavorable result leads to a defined investigation and follow-up. Compare actual performance with the target, identify the process or supplier condition behind the variance, and agree on a corrective action. For example, recurring invoice mismatches could prompt a review of purchase-order fields and supplier invoice instructions. Reassess the same measure after the change to determine whether the underlying issue has been resolved.
How can teams boost their performance with procurement KPI tracking and reporting?
Teams can improve reporting by making each KPI traceable to a data owner, calculation, and decision. A category manager should be able to move from a report exception to the relevant purchase orders, contract terms, or supplier records. Use dashboards to surface deviations and trend changes while keeping definitions consistent across business units. A concise action log can record each review’s owner, next step, and outcome.
How do procurement cost avoidance KPIs capture prevented future spend?
Cost avoidance KPIs document the difference between a credible future-cost baseline and the expected cost after procurement intervention. Record the forecast assumptions, supporting market or supplier evidence, the action taken, and the revised exposure. Keep this value separate from savings recognized against actual purchases. For example, a renegotiated price ceiling may limit a forecast increase, while realized savings require evidence that purchases used the improved terms.
How do procurement metrics align procurement with overall business objectives?
Translate a business objective into a procurement outcome, then select a metric that reflects the connection. If the objective is reliable production, teams can monitor supplier continuity and incoming quality alongside sourcing cost. If the priority is cash discipline, measures can focus on purchasing compliance and payment-process performance. This alignment gives finance, operations, and procurement a shared basis for assessing trade-offs instead of rewarding a local improvement that harms another function.
How do you calculate procurement ROI and prove procurement’s business value?
Calculate procurement ROI by dividing total cost savings by total procurement costs, then multiplying by 100. To make the result credible, define which savings and internal costs count, use a consistent reporting period, and retain evidence for each calculation. Connect reported results to sourcing events, negotiated terms, and actual purchasing records. This gives finance a basis to assess procurement’s cost effectiveness and distinguish verified outcomes from estimates or forecast benefits.
How should SMART targets be defined for each KPI?
Define a SMART target by specifying the result, how it will be measured, a feasible level of improvement, its relevance to a business objective, and the deadline. Establish a baseline and data source before assigning an owner. For a supplier-quality target, state which defects count and how the rate is calculated; for a process target, define the start and end points. A clear review date makes progress assessable and follow-up actionable.


